
Tool selections
From the tool's homepage, users select options for the 4 dropdown boxes to specify a desired prioritization scenario. These selections determine the scale and geography of the scenario, the management focus, and the tuning.
Geographic scale
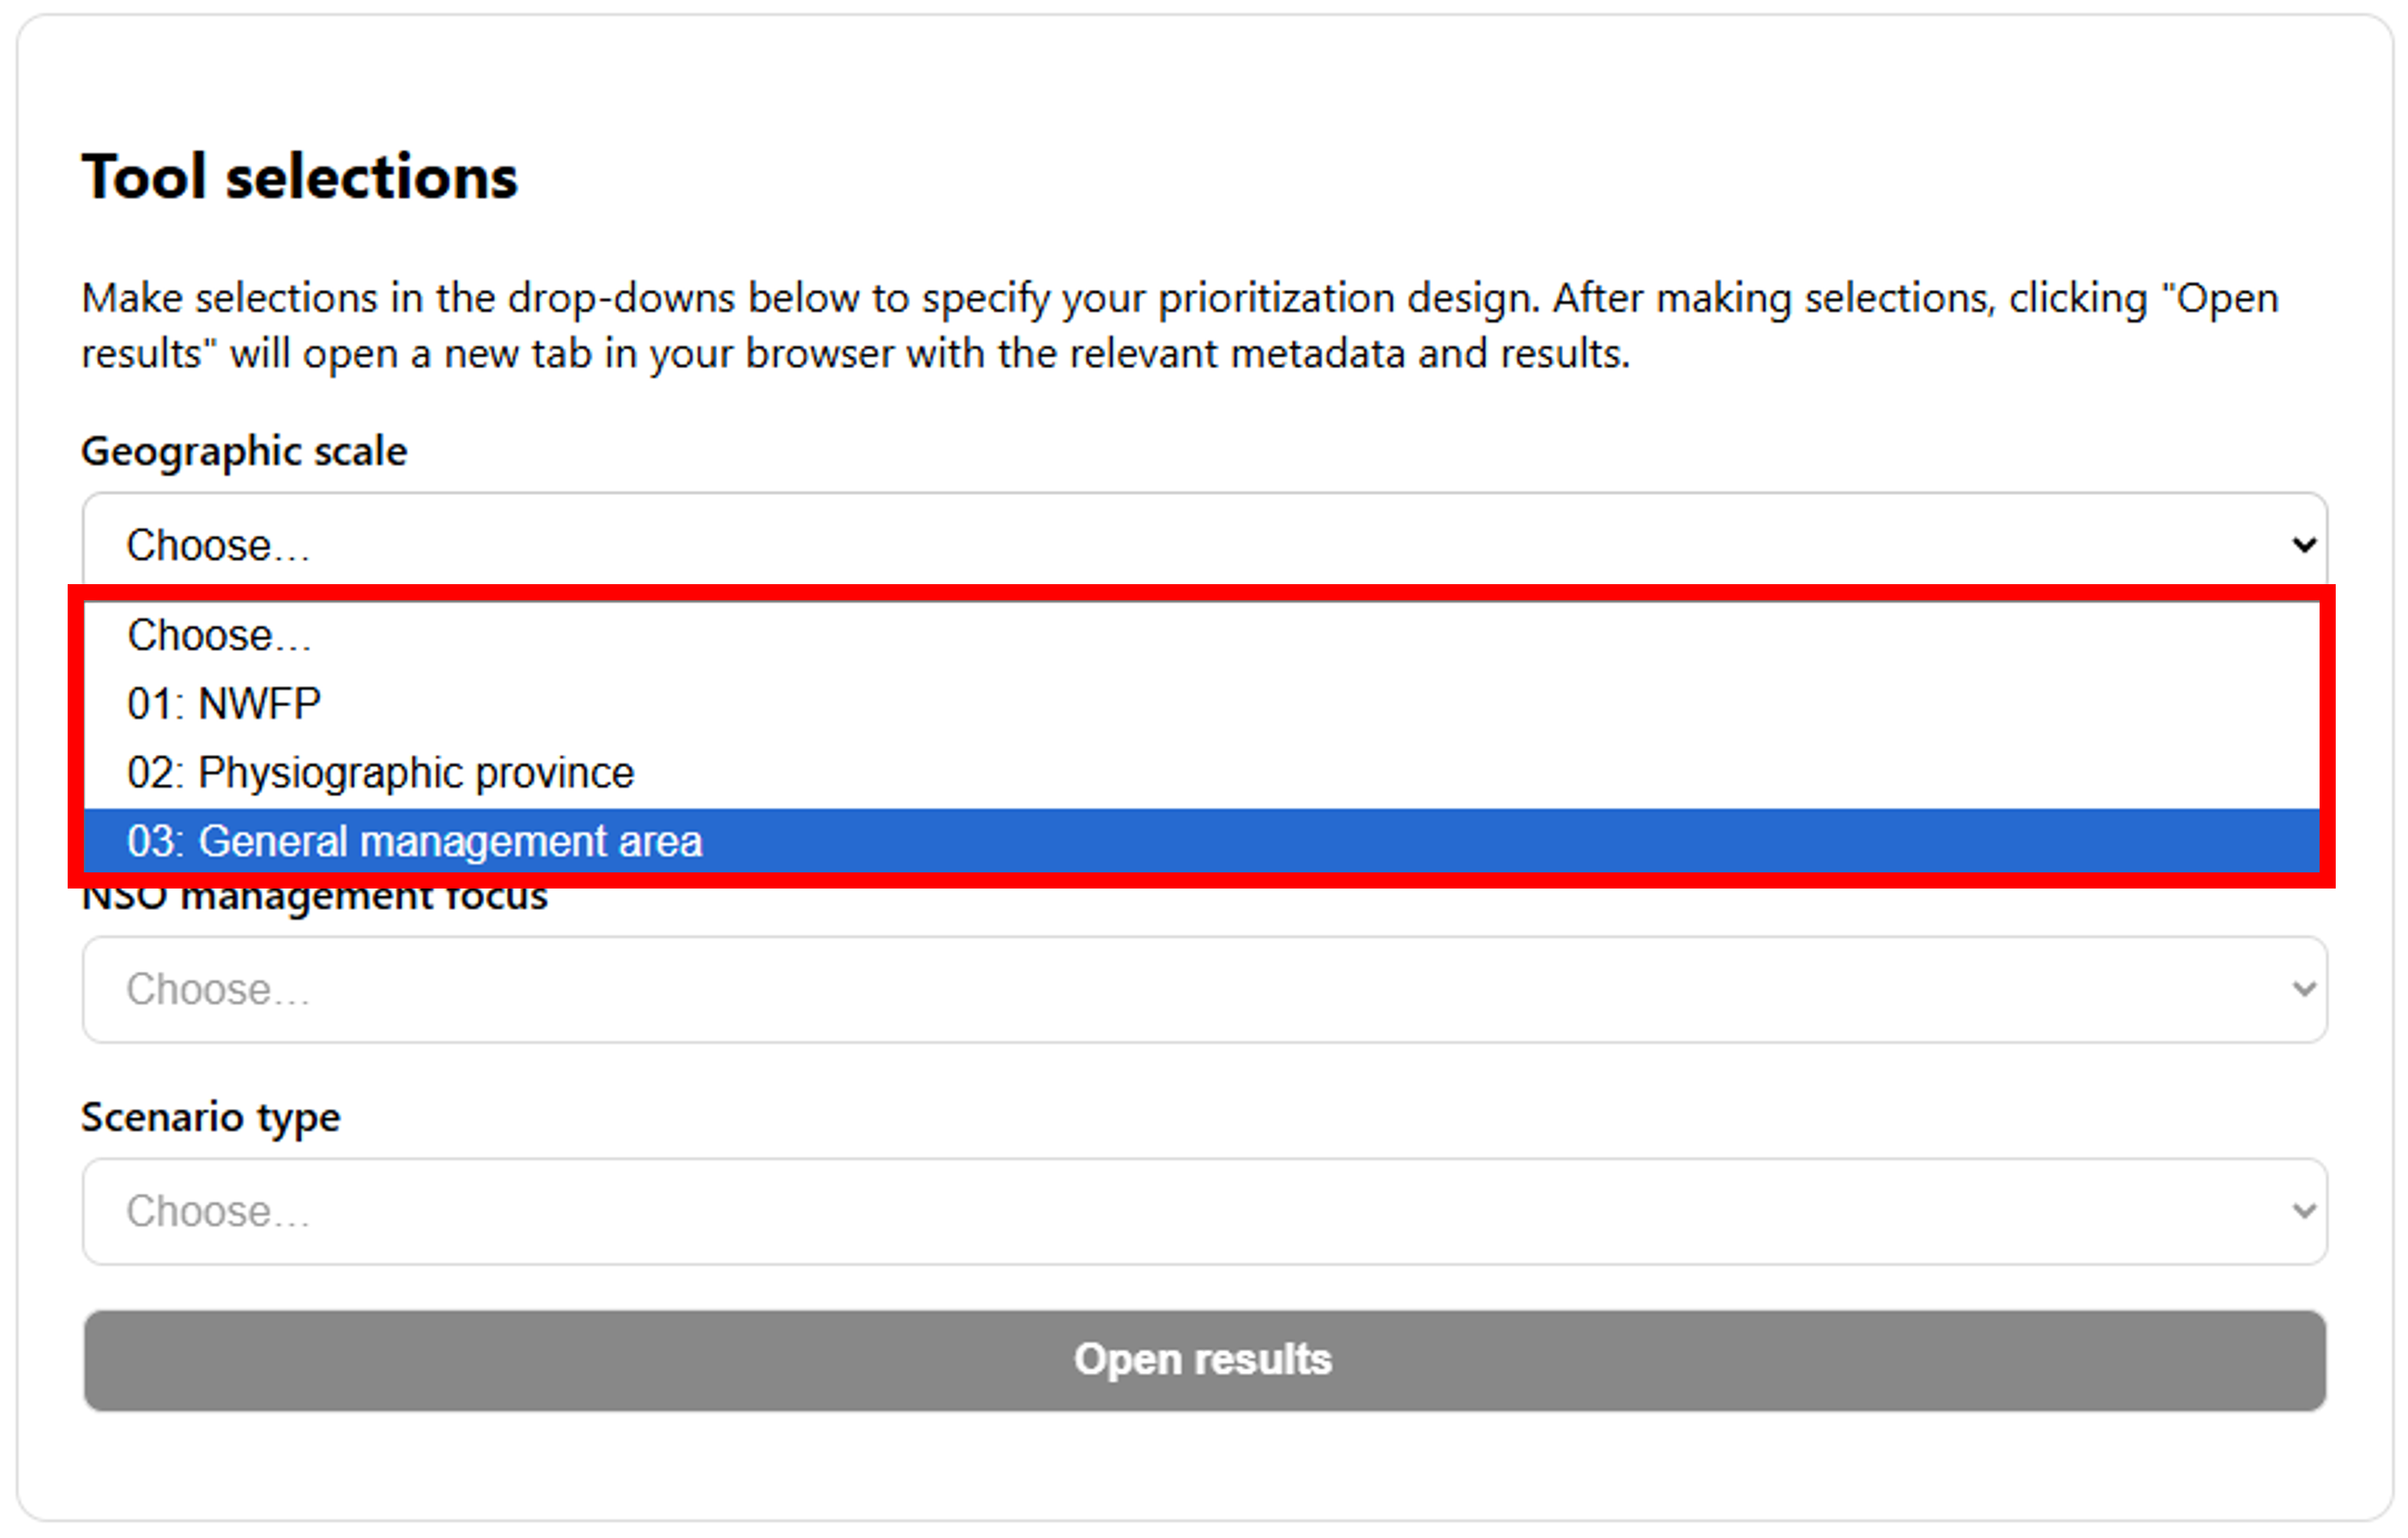
Here users can select whether they want prioritizations carried out at one of three scales:
- Northwest Forest Plan (NWFP) region
- Physiographic provinces within the NWFP region
- General Management Areas & special designated areas delineated in the Barred Owl Management Strategy
See the Spatial references page for geographic boundaries.
Management unit
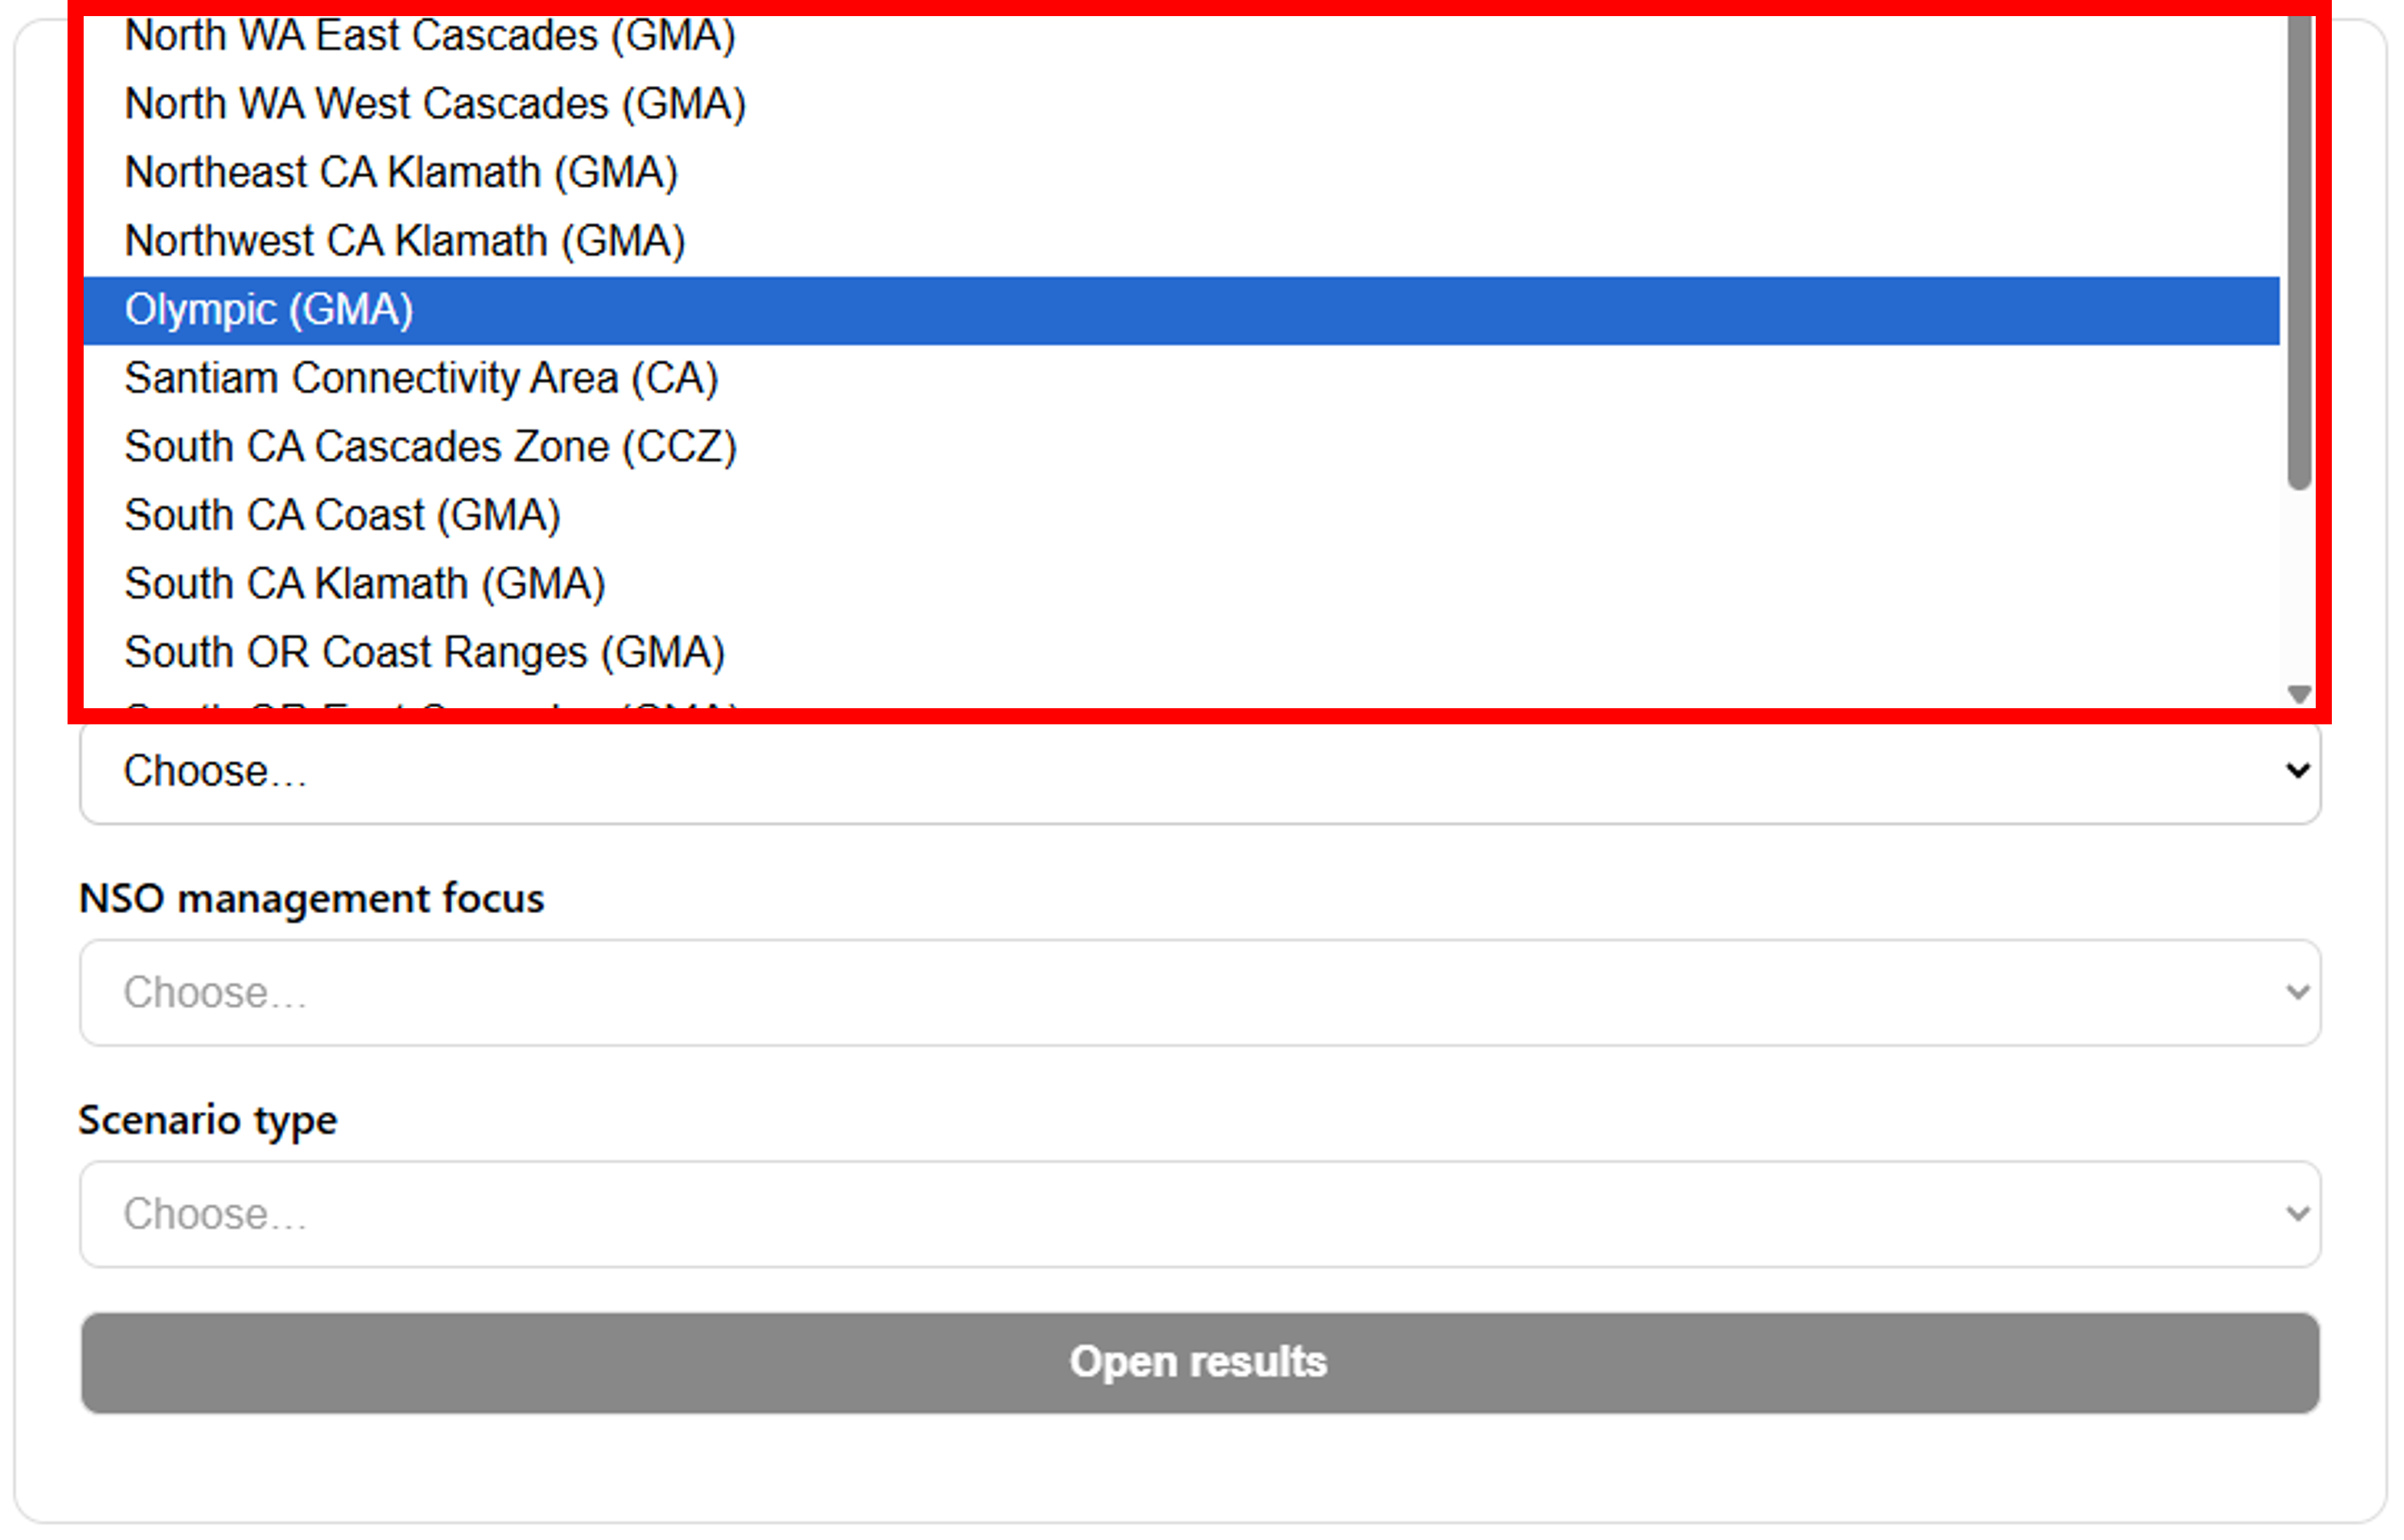
Depending on the Geographic scale selected, users will be presented with different options:
- If the NWFP scale was selected, there is only one option: the entire region (which is also the US range of the NSO)
- If physiographic province was selected, users can now select one of the 10 provinces with a reasonable amount of forested area (i.e., excluding the Willamette Valley province)
- If GMA was selected, users can now select one of the 42 General Management Areas & special designated areas that are delineated in the Barred Owl Management Strategy
NSO management focus
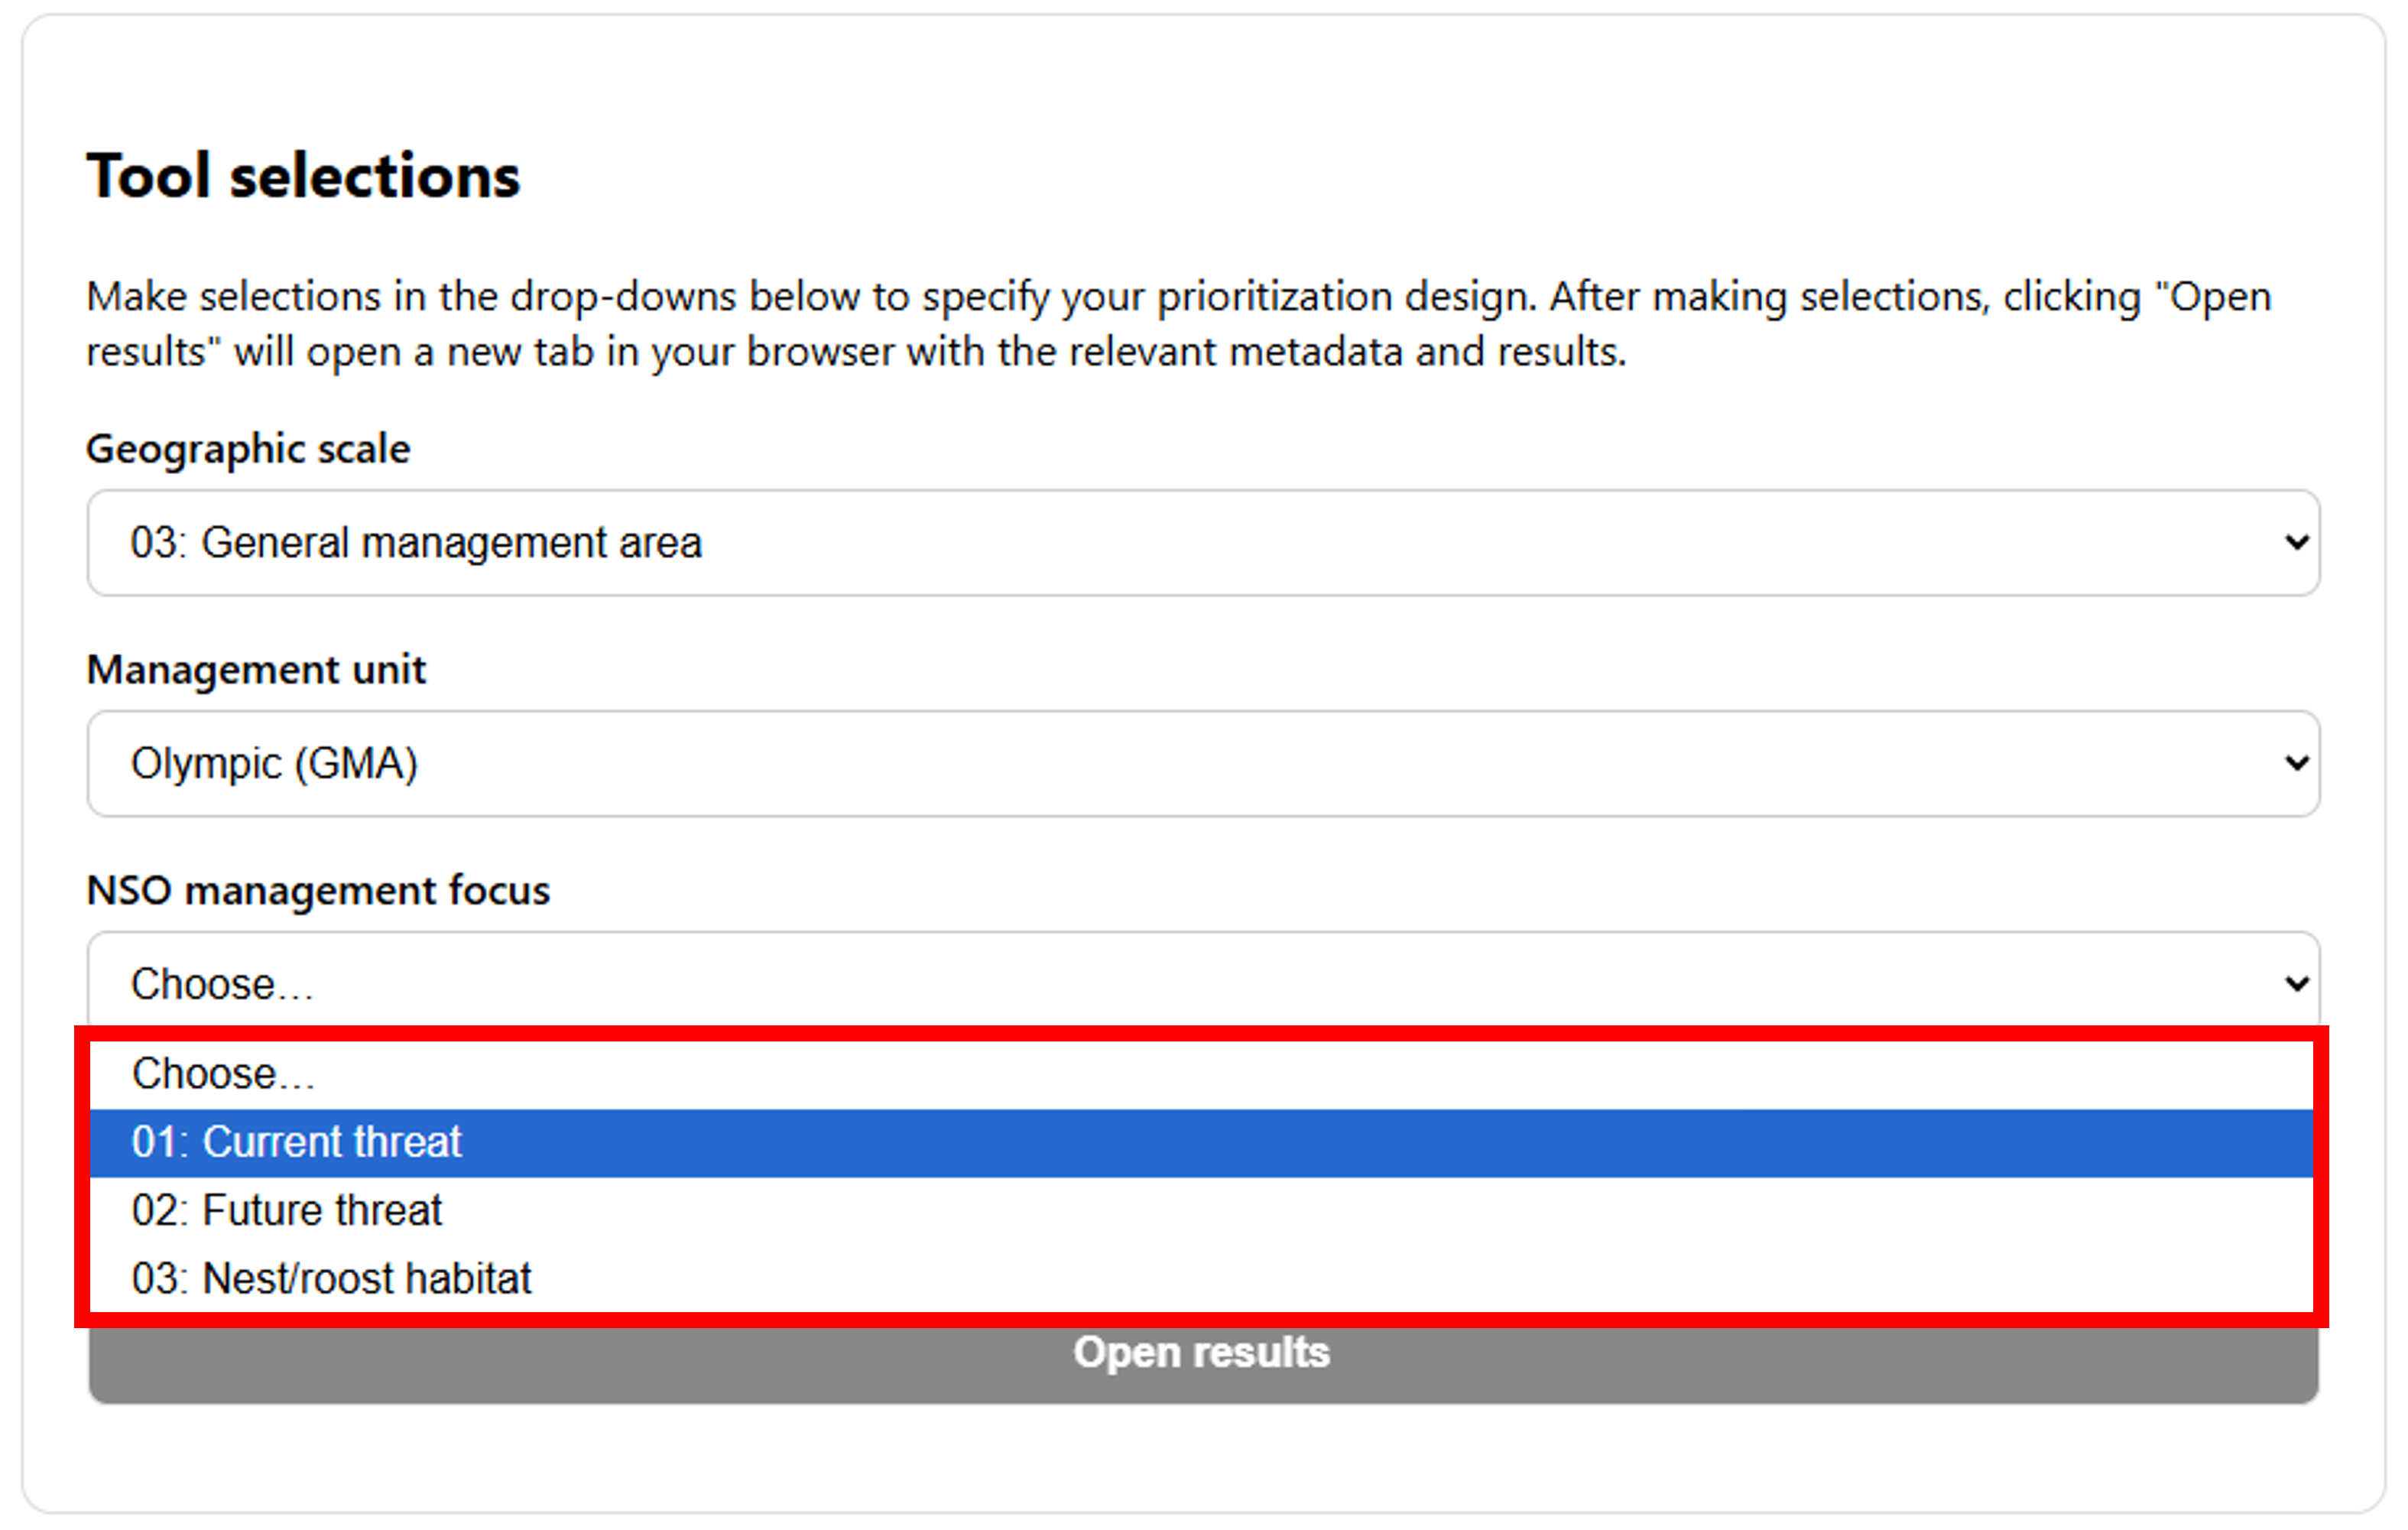
With the Geographic scale and Management unit selected, users now select their NSO management focus. In alignment with the USFWS Strategy, this tool is largely focused on managing barred owls for the benefit of northern spotted owls (although biodiversity is also incorporated, see below). The NSO management focus tells the tool what we are particularly concerned about and is a central decision. There are three options:
- Current threat: this option tells the tool that a user is most interested in addressing the threats that barred owls currently pose to spotted owls. Conceptually, it prioritizes areas where both barred and spotted owls are expected to occur at relatively high probabilities. This option may be most relevant to users working in areas where barred owls are relatively ubiquitous but some spotted owl remnant populations occur. The most likely management strategy implemented in areas with high current threat is intensive barred owl removals.
- Future threat: this option tells the tool that a user is most interested in addressing the threats that barred owls will pose to spotted owls in the future. Conceptually, it prioritizes areas where spotted owls are expected to occur at relatively high probabilities but barred owls are expected to occur at low probabilities, making the assumption that if barred owl population growth continues they will increase in prevalence in these areas. This option may be most relevant to users working at the invasion front or with limited resources. The most likely management strategy in areas with high future threat is monitoring, early detection, and rapid response to colonizing or increasing barred owls.
- Nest/roost habitat: Whereas the two threat options incorporate the (predicted) current distribution of barred and spotted owls, this option prioritizes management based solely on the distribution of forests suitable for spotted owl nesting and roosting. This option may be most appropriate for users working in landscapes with very few remnant spotted owls (e.g., efforts to clear barred owls from areas of suitable habitat, followed by spotted owl reintroduction).
Scenario type
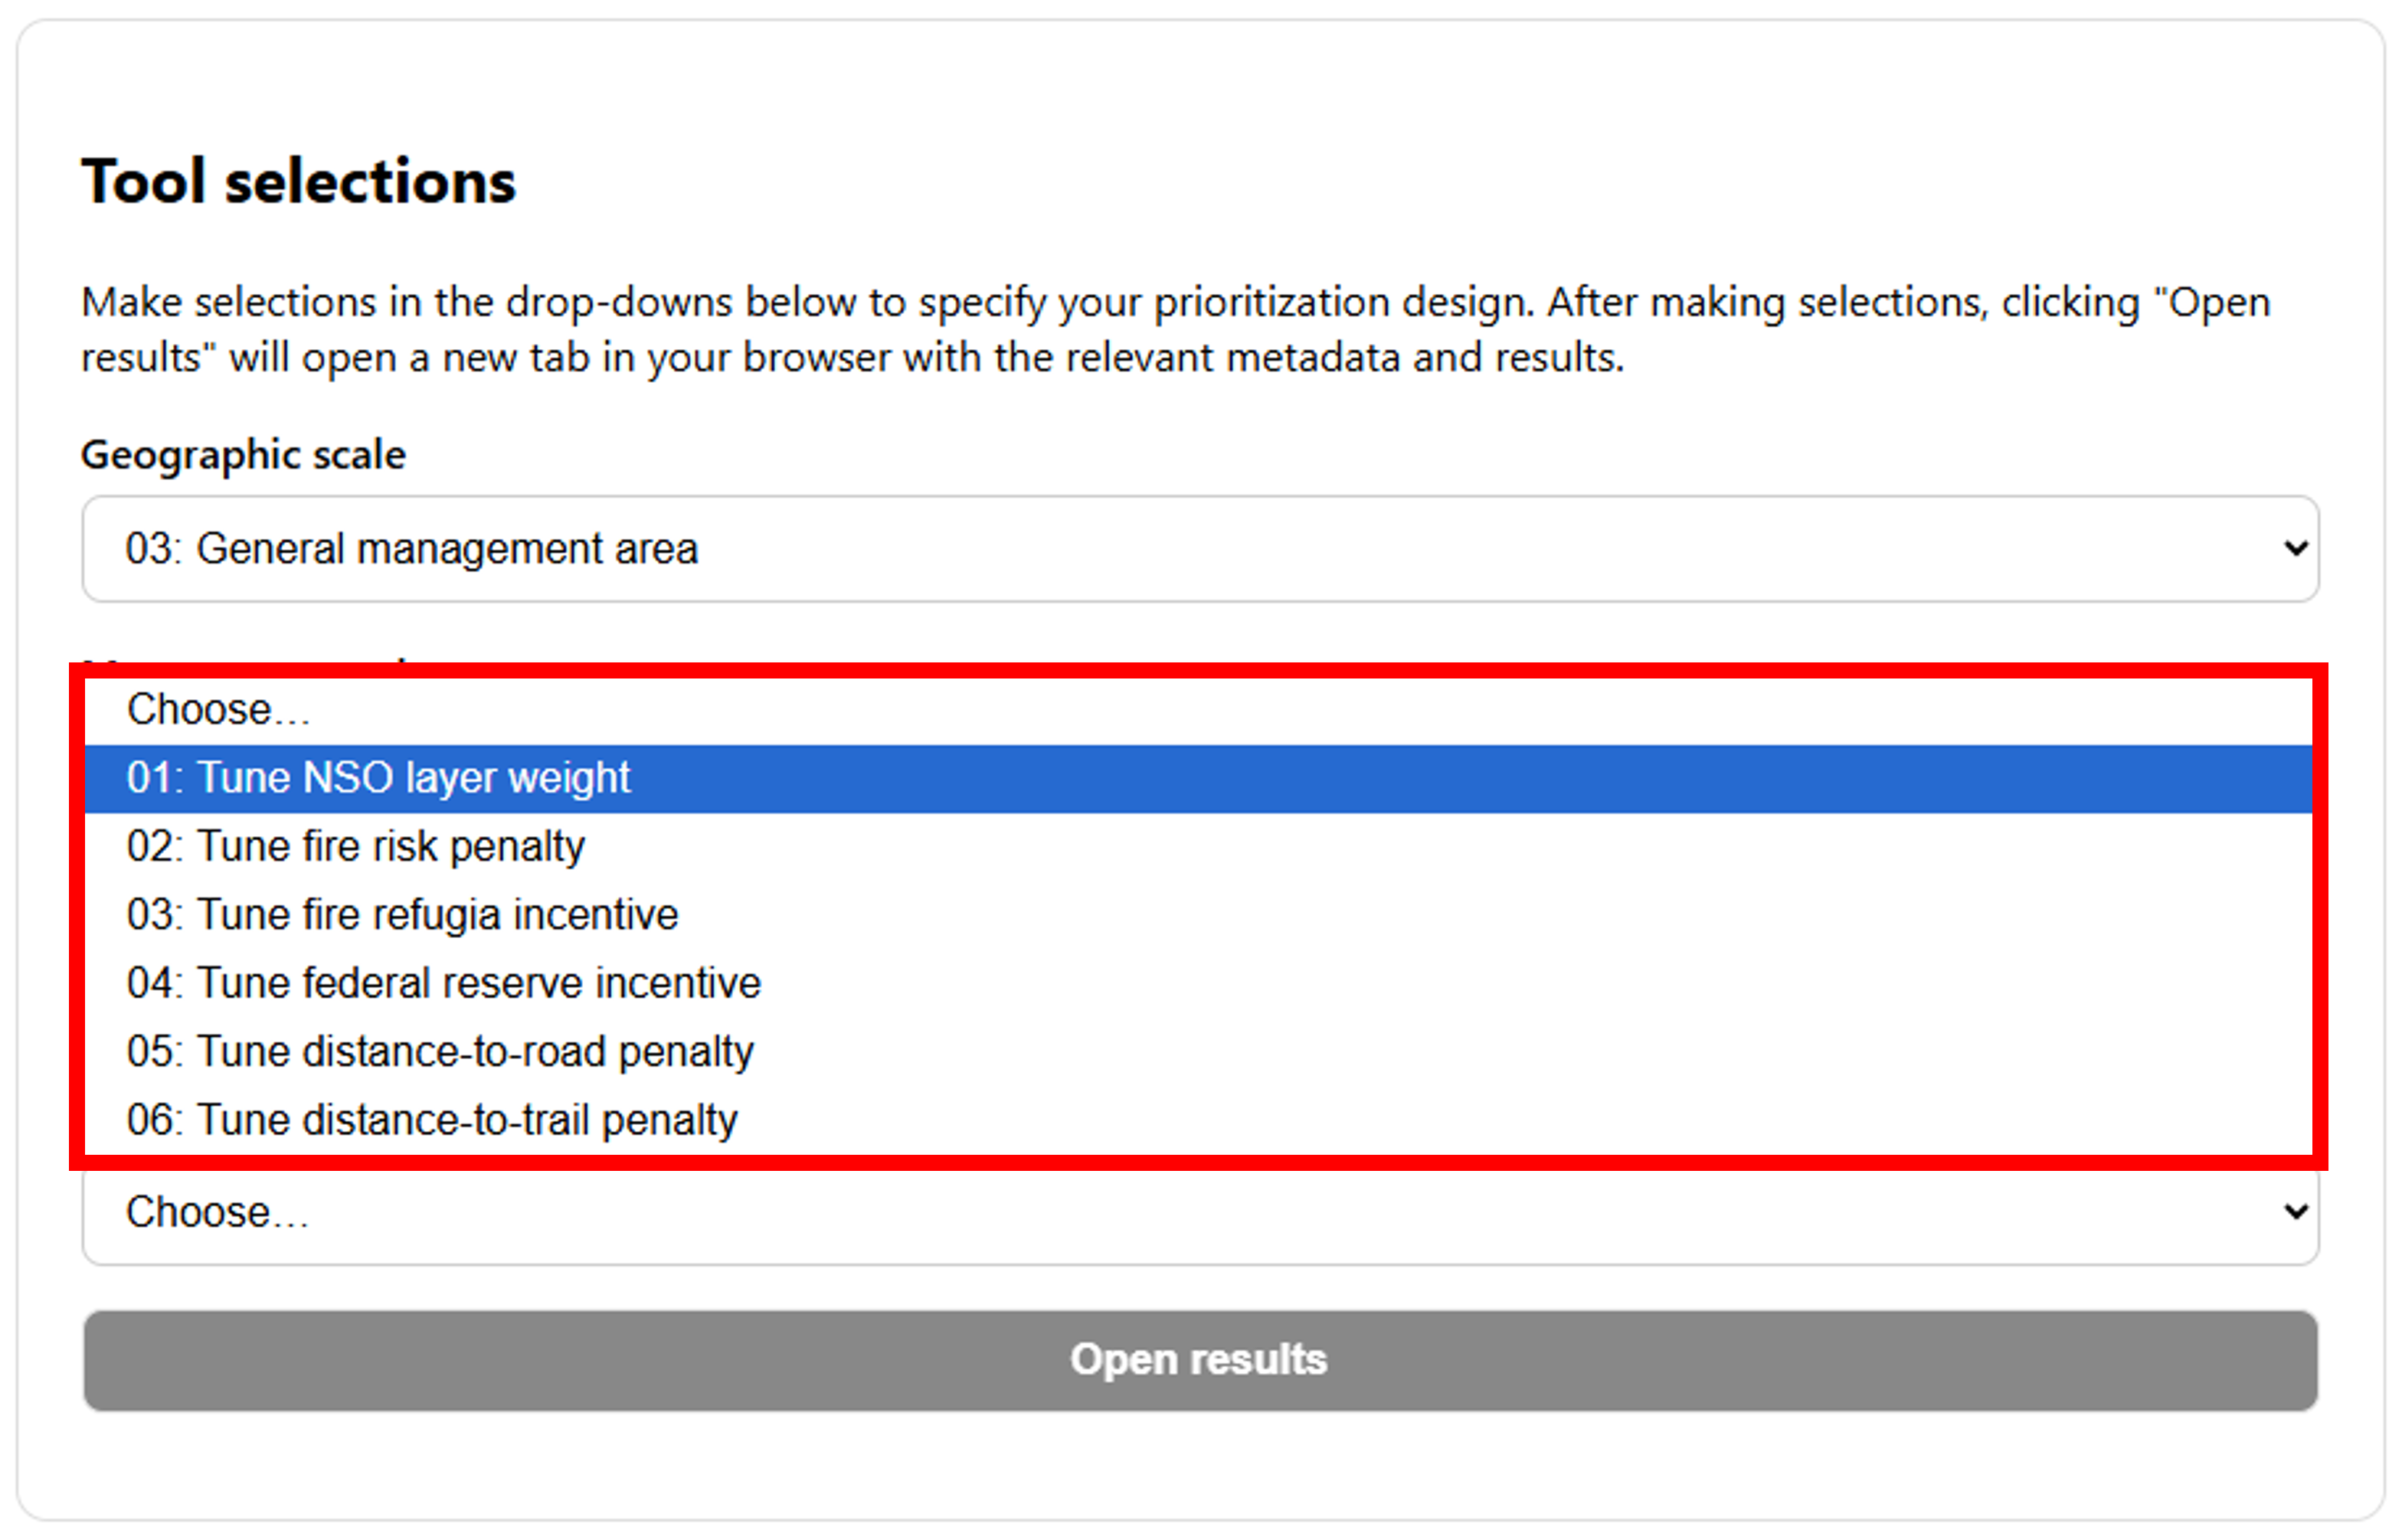
The final selection tells the tool what input we want to tune. Each results page contains the outcome of three prioritization scenarios, where the weight assigned to an input varies from low to medium to high. At this stage, the user selects which input to vary in the results scenarios. There are six options available:
- NSO layer weight: Selecting this option produces scenarios that vary the weight assigned to whichever NSO management focus was selected above. This is the best starting place when exploring prioritization outcomes. Importantly, this option also provides access to biodiversity-focused prioritizations: it will produce a scenario where the NSO layer weight is low and prioritization results represent the optimal location for barred owl management when considering the geographic ranges of 43 species putatively at-risk from barred owl predation and competition. More information on interpretation of this result is provided below.
- Fire risk penalty: Selecting this option produces scenarios that increasingly penalize fire risk. This option is likely to be especially relevant in the drier and more fire-prone areas in the region.
- Fire refugia incentive: Selecting this option produces scenarios that increasingly incentivize fire refugia.
- Federal reserve incentive: Selecting this option produces scenarios that increasingly incentivize areas with greater coverage of land allocated as federally reserved under the NWFP. For some users, there may be impetus to increase overlap between federal reserve and new conservation actions like barred owl control, which can be accomplished with this option.
- Distance-to-road penalty: Selecting this option produces scenarios that increasingly penalize distance to road. Given the importance of roads for accessing land during owl surveys and barred owl removals, this is likely a key logistical factor.
- Distance-to-trail penalty: Selecting this option produces scenarios that increasingly penalize distance to trails. Although trails are used less than roads for barred owl removals, in some areas (e.g., roadless wilderness areas) trails provide key access to remote areas.
Open results
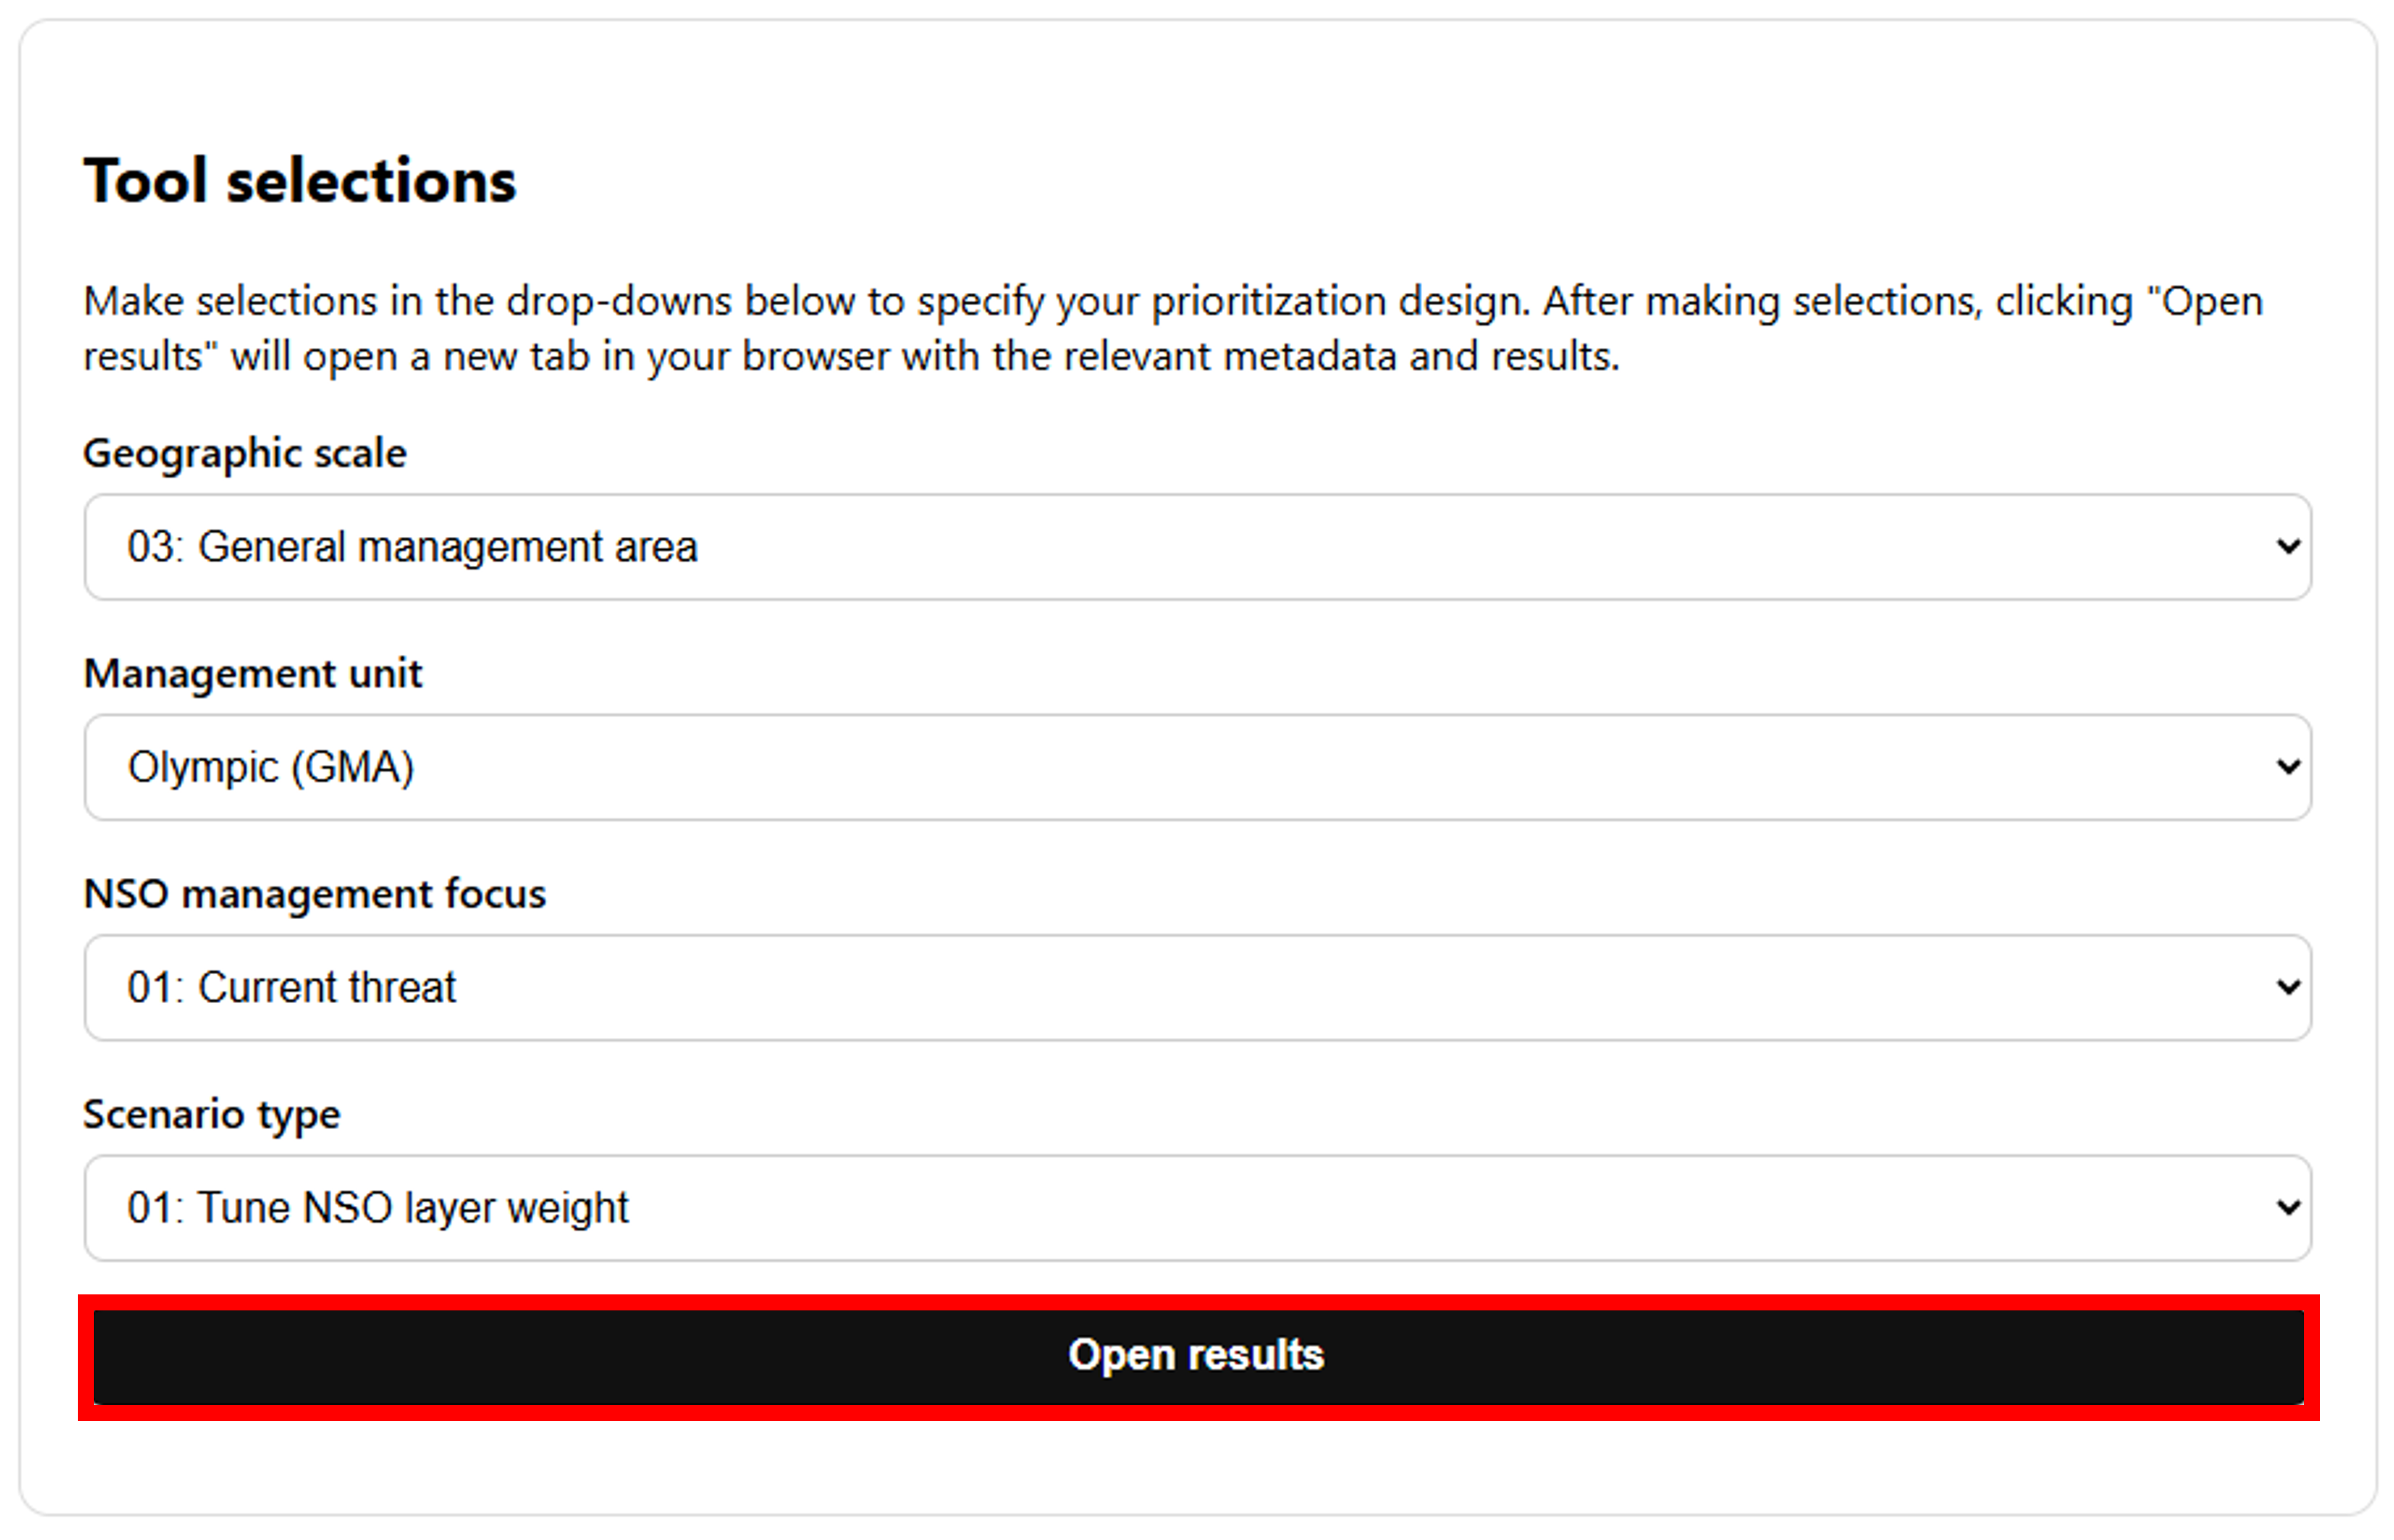
Once the above options are selected, click Open results to access prioritization outcomes in a new tab.
Tool results
Metadata
At the top of each page is a box containing relevant metadata, including the settings selected on the tool's homepage, the size of the region being prioritized (in number of 5 km2 hexagonal cells), and the budget (also in number of hexes). The budget is the number of cells that are prioritized and is always fixed at one-half of the region size, which aligns with the USFWS Strategy's guidance that FMAs should cover no more than 50% of any given GMA.

Scenario Table
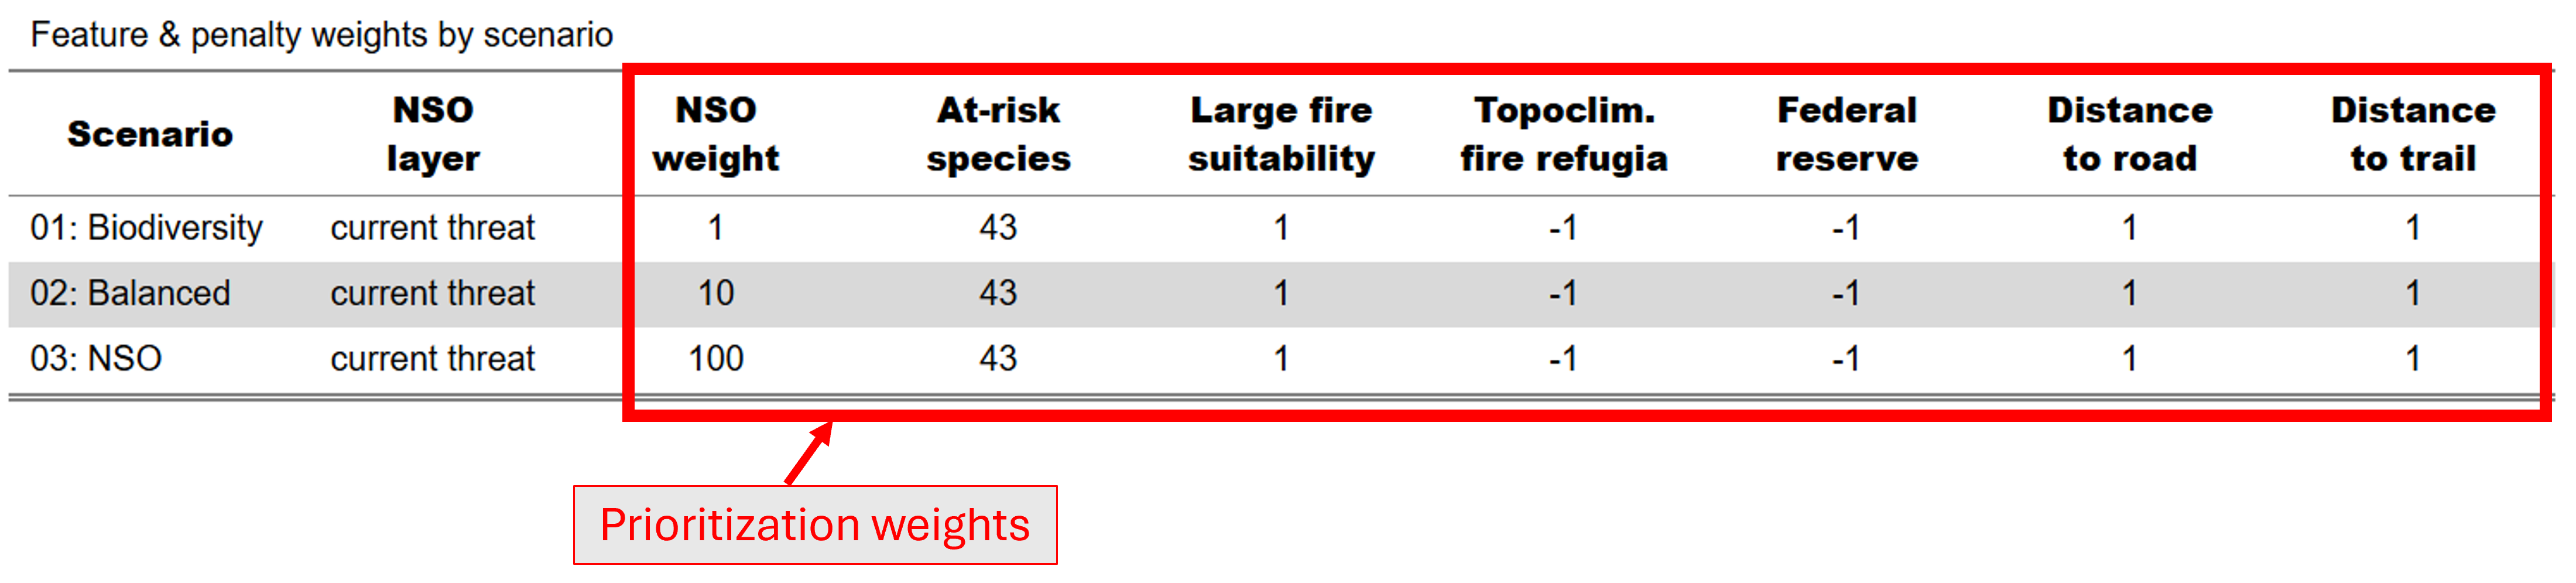
This table contains descriptive information and weightings for the three scenarios on the results page. Scenario is descriptive, and when tuning NSO layers (i.e., NSO layer weight was selected for Scenario type on the homepage) lists "01: Biodiversity", "02: Balanced", and "03: NSO". Scenario 01 is "Biodiversity" because the weight assigned to the relevant NSO layer (second column) is low and prioritization outcomes are driven by the combined geographic distributions of the 43 at-risk species included in the tool (see the Methods page for full list). Scenario 02 is described as "Balanced" because the influence of NSO relative to the suite of at-risk species is intermediate, whereas 03 is "NSO" because the influence of NSO on outcomes outweighs the suite of species. Columns 3 through 9 provide the weights used to specify the prioritizations.
Interactive Map
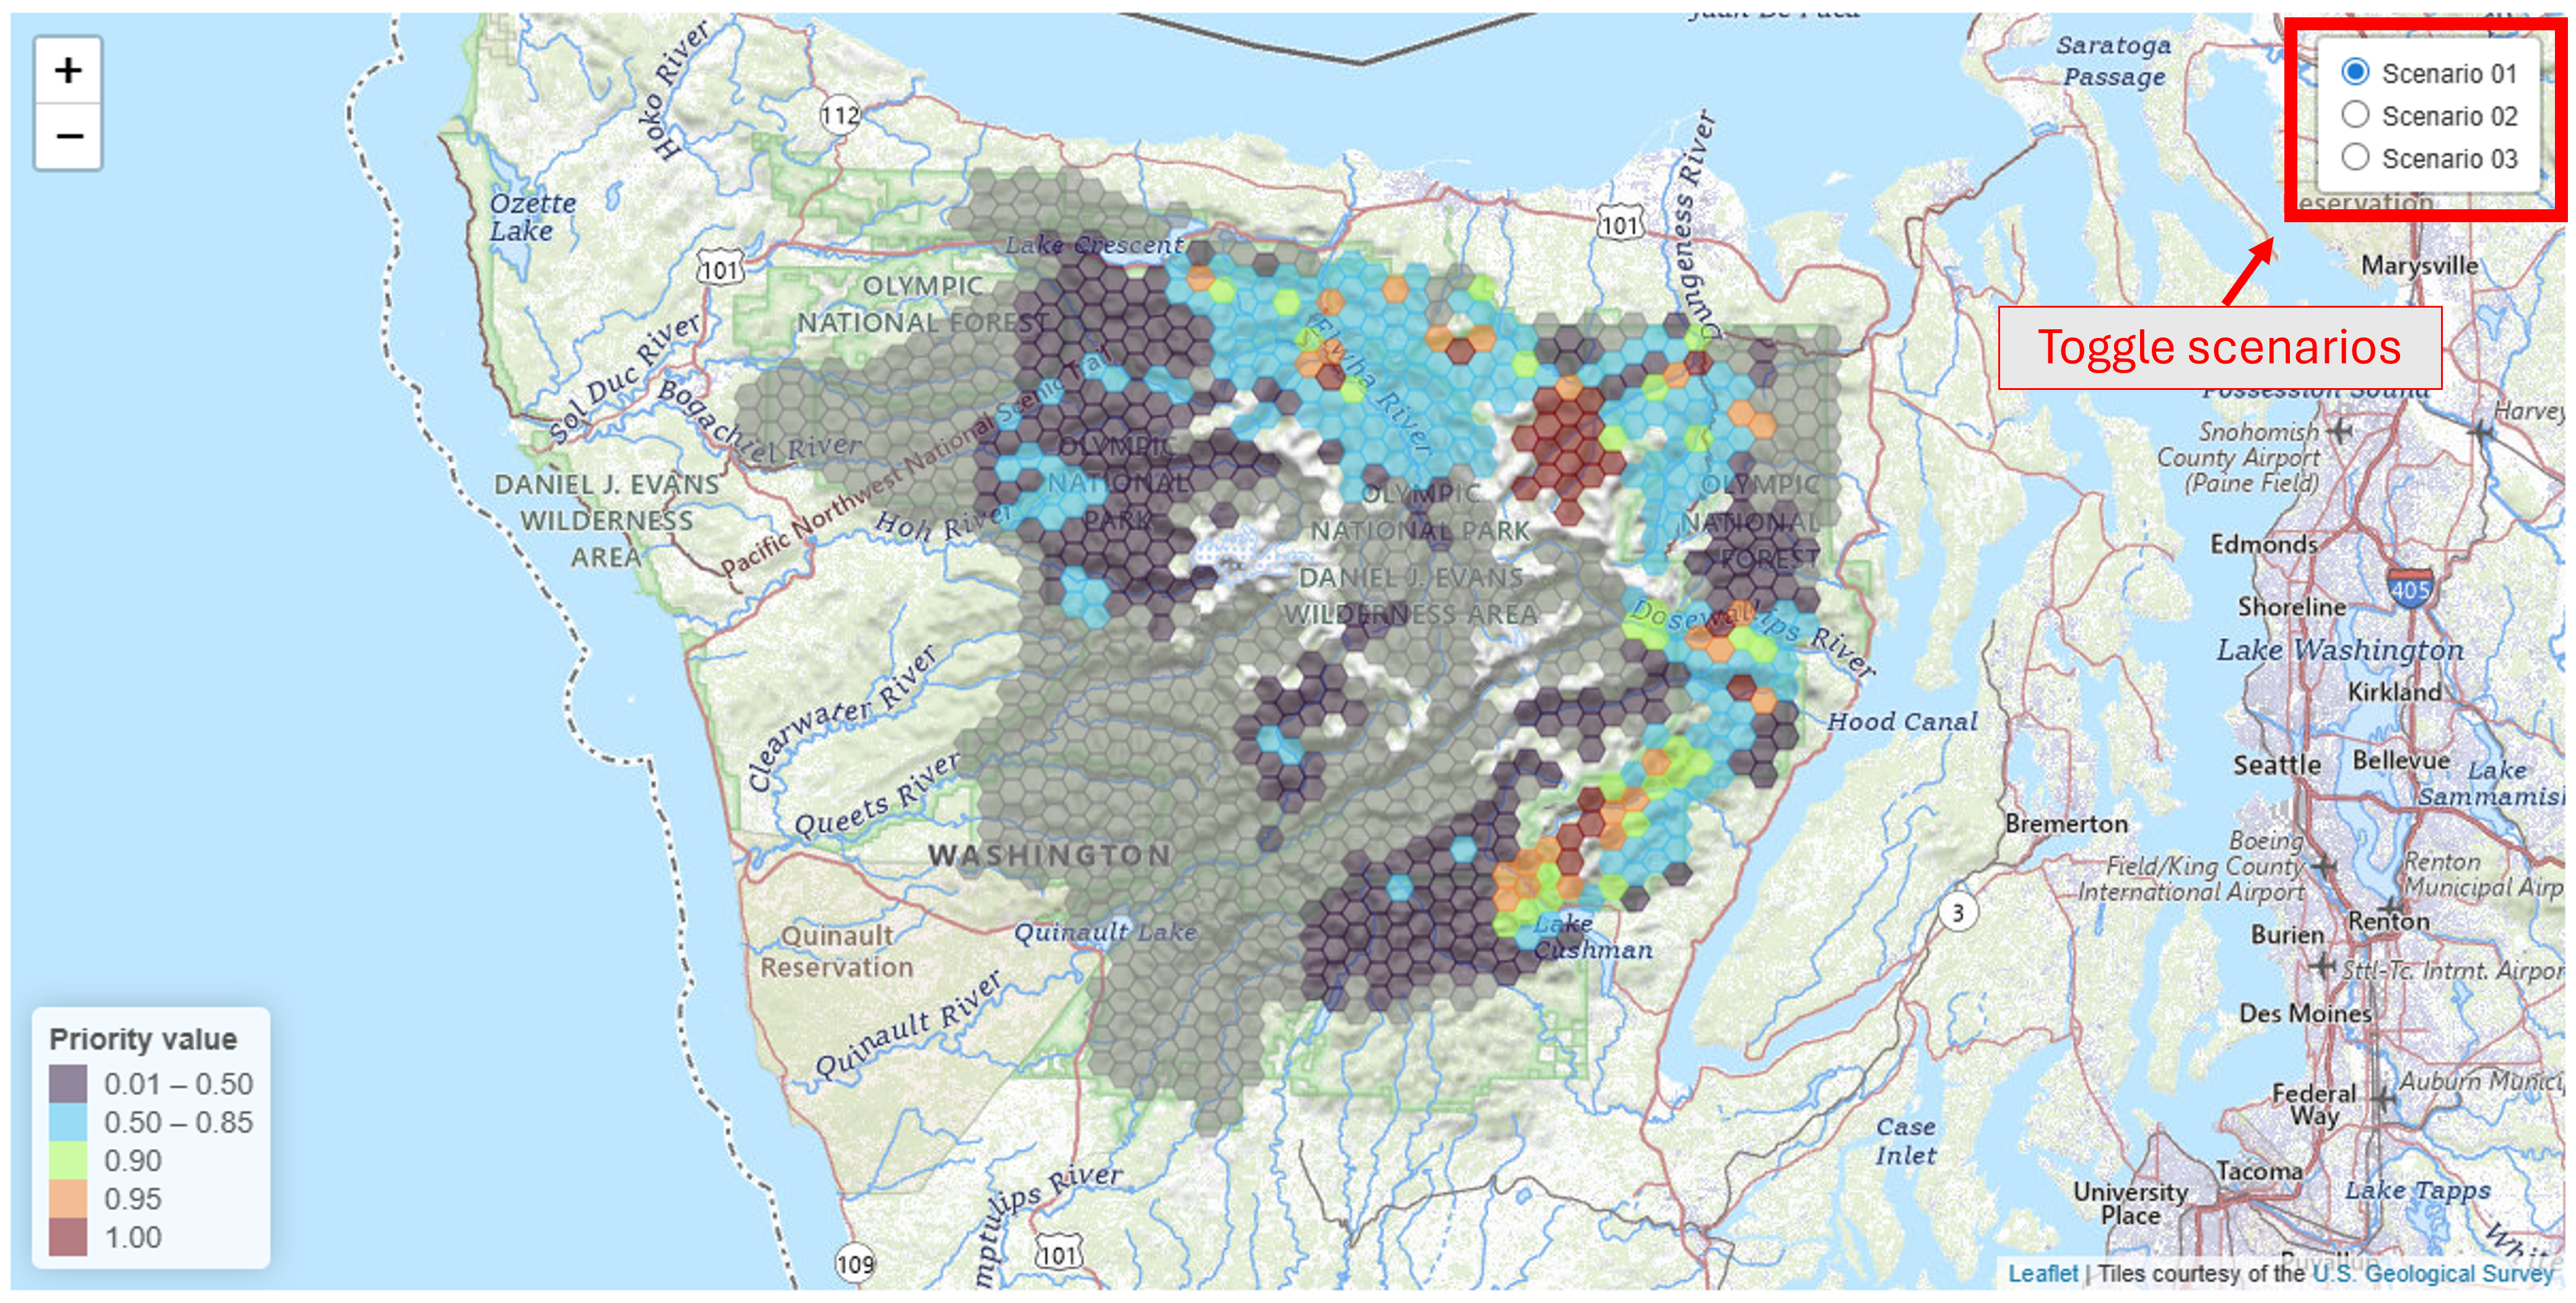
The interactive map contains the primary results of each prioritization scenario: a hex-by-hex breakdown of areas identified as important for barred owl management (and their relative priority) based on the settings specified on the homepage. Scenarios can be toggled between using the radio buttons in the top right corner of the map, allowing for rapid comparison of high-priority areas under different specifications. Colors represent each hex's relative importance score with warmer colors denoting higher scores, and gray hexes are those not identified as a priority for barred owl management (under the 50% budget). Note that the number of hexes with the highest priority score (1.00 - shown in red on the map) is equal to 5% of the budgeted cells; e.g., if the metadata box at the top of the page states that there was a budget of 100 hexes, 5 will receive the highest-priority score and be shown in red on the map. Individual hexes on the map can be clicked to show several values: the HexID (which is shared with the grid used for bioacoustic surveys), the hex's priority score (NA if gray), NSO occupancy probability, barred owl occupancy probability, and the % of the hex that is estimated to be NSO habitat. Values for additional layers can be viewed on the Spatial references page.
Downloads
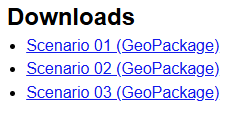
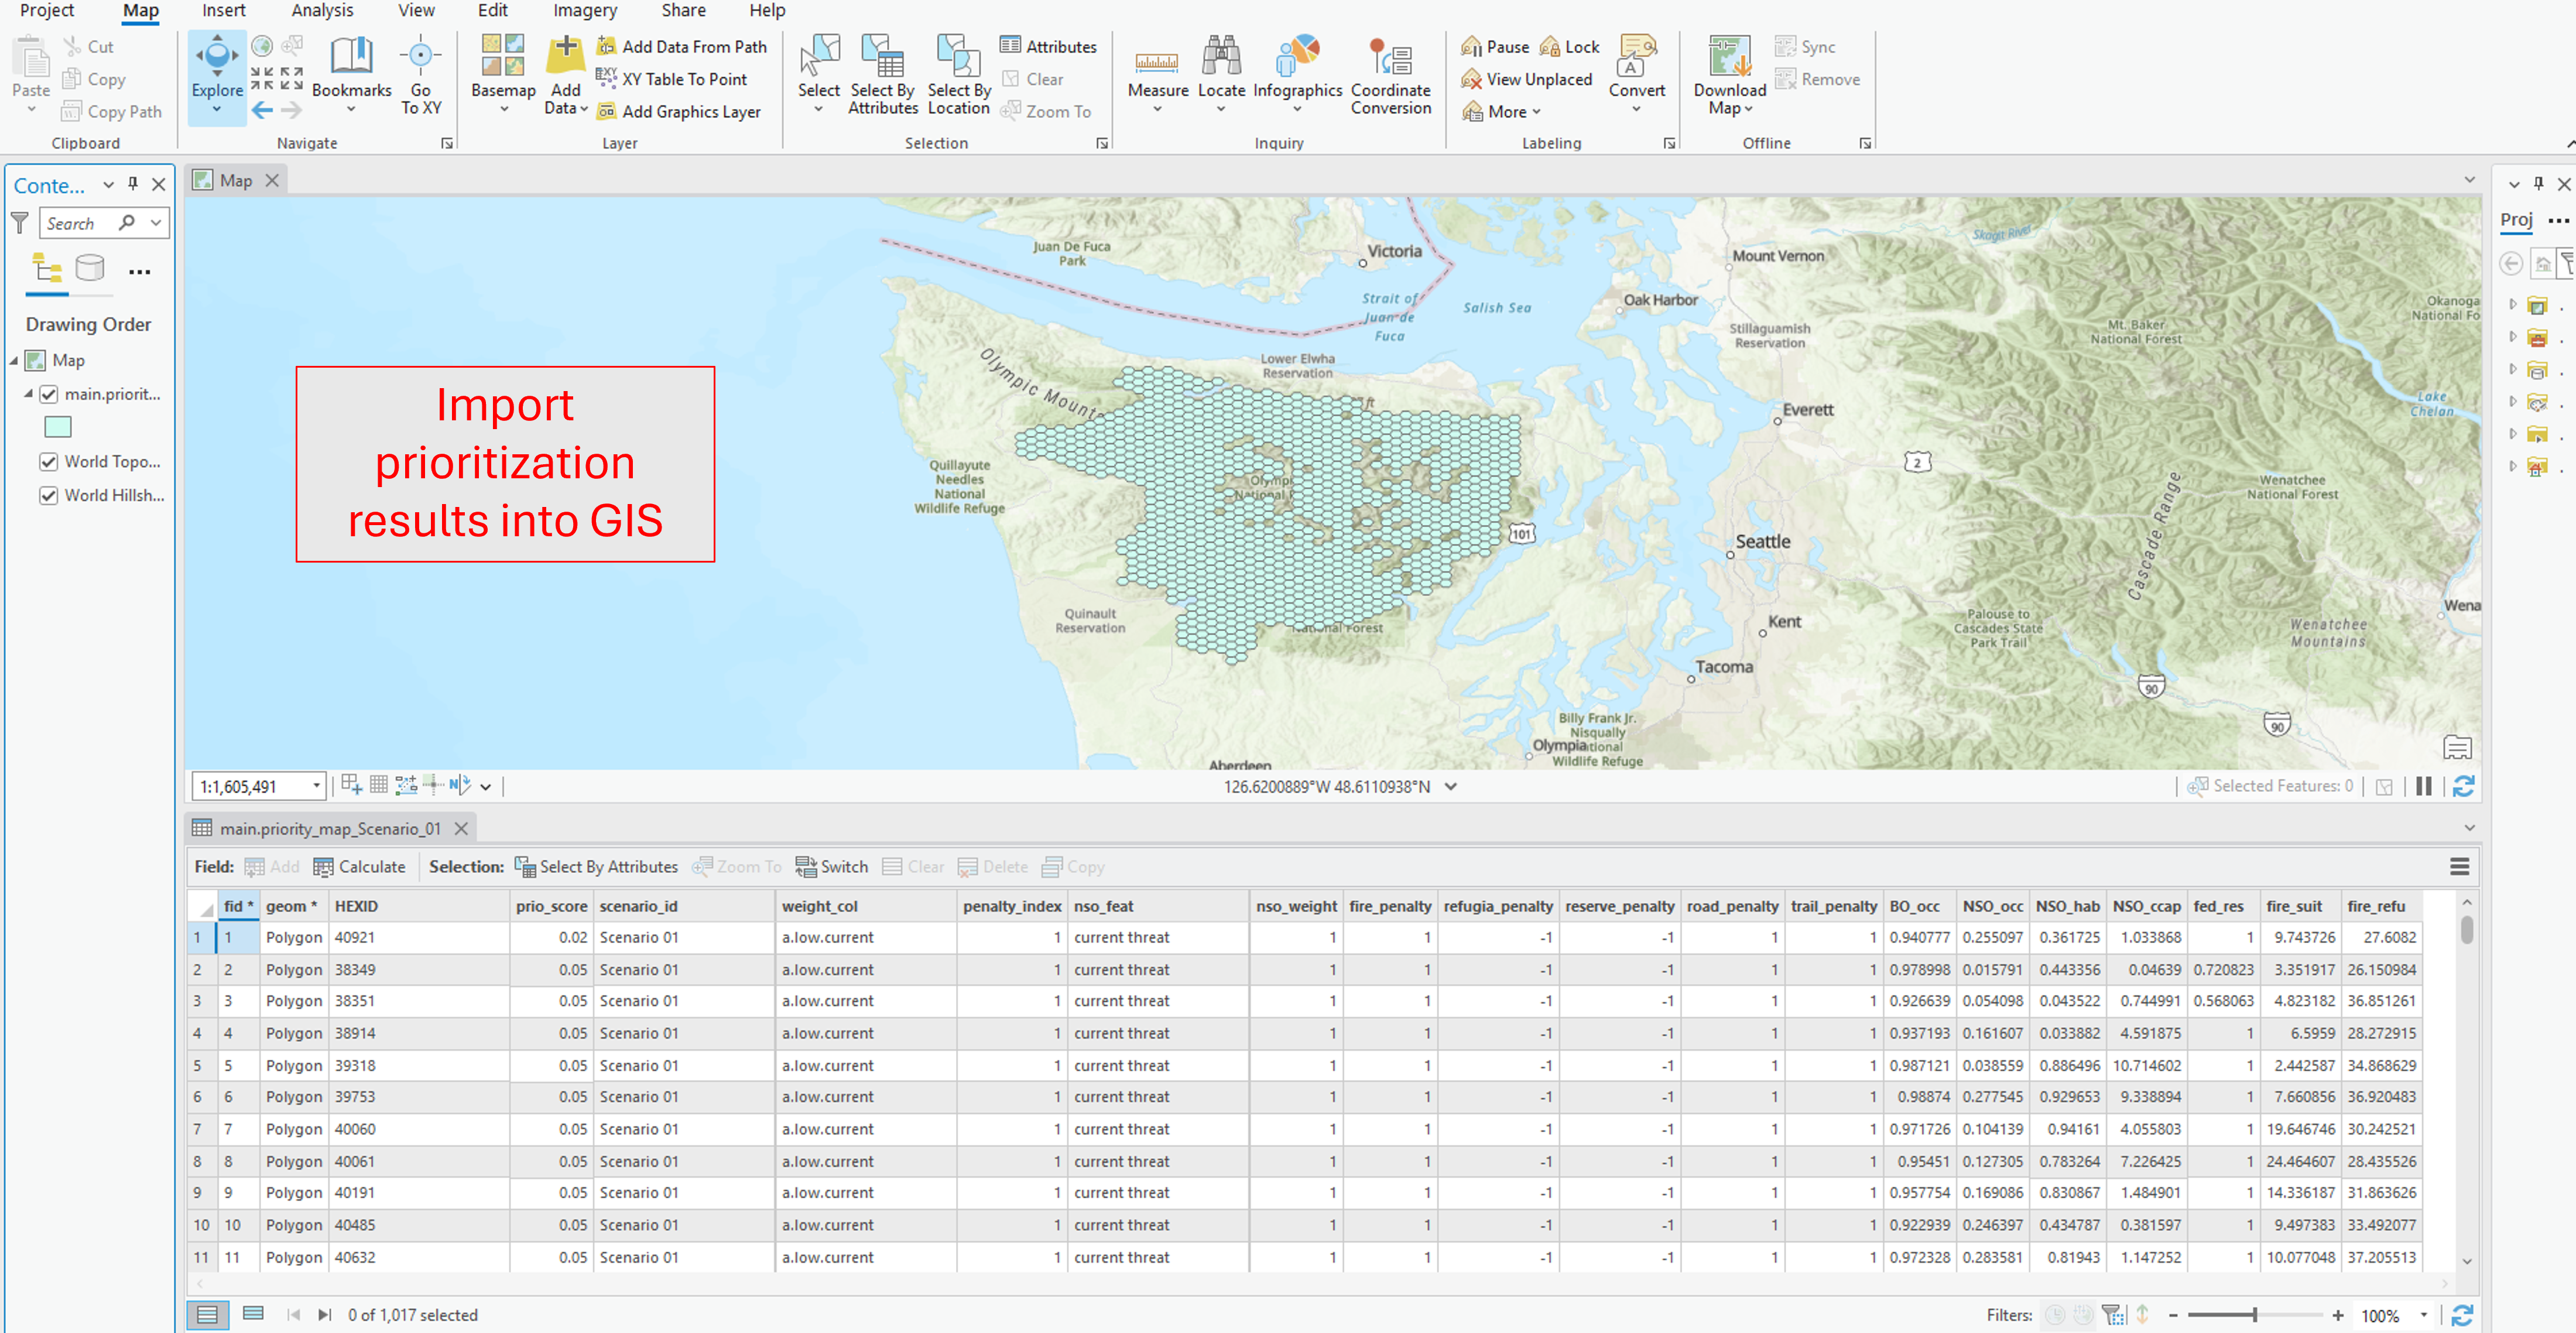
The interactive map is useful for rapid exploration of prioritization results, but many users will wish to explore results using GIS software. The hex layers shown in the interactive map are available for download in GeoPackage format in the Downloads section. Clicking the link for the desired scenario will download the relevant GeoPackage, which stores hexes as a polygon layer whose attribute table provides hex-level data including: HexID, priority score, scenario metadata, and select spatial layer values. Users can then overlay prioritization results with their own spatial data, create ensembles of high-priority areas under different specifications, and aggregate high-priority cells into FMAs.
Summary Table
Here users can see how relevant layers shift across scenarios in high-priority hexes (score=1.00, red on the interactive map). Values provided include penalty and incentive layers, plus barred owl occupancy, NSO occupancy, NSO habitat, and NSO carrying capacity (sensu Glenn et al. 2017). Note that interpretations based on this table are qualitative because values are tabulated from layers that are rescaled to have a minimum of 0 and a maximum of 1. Thus, this table provides a quick evaluation of how important layers shift across prioritization scenarios.

Histogram Plot
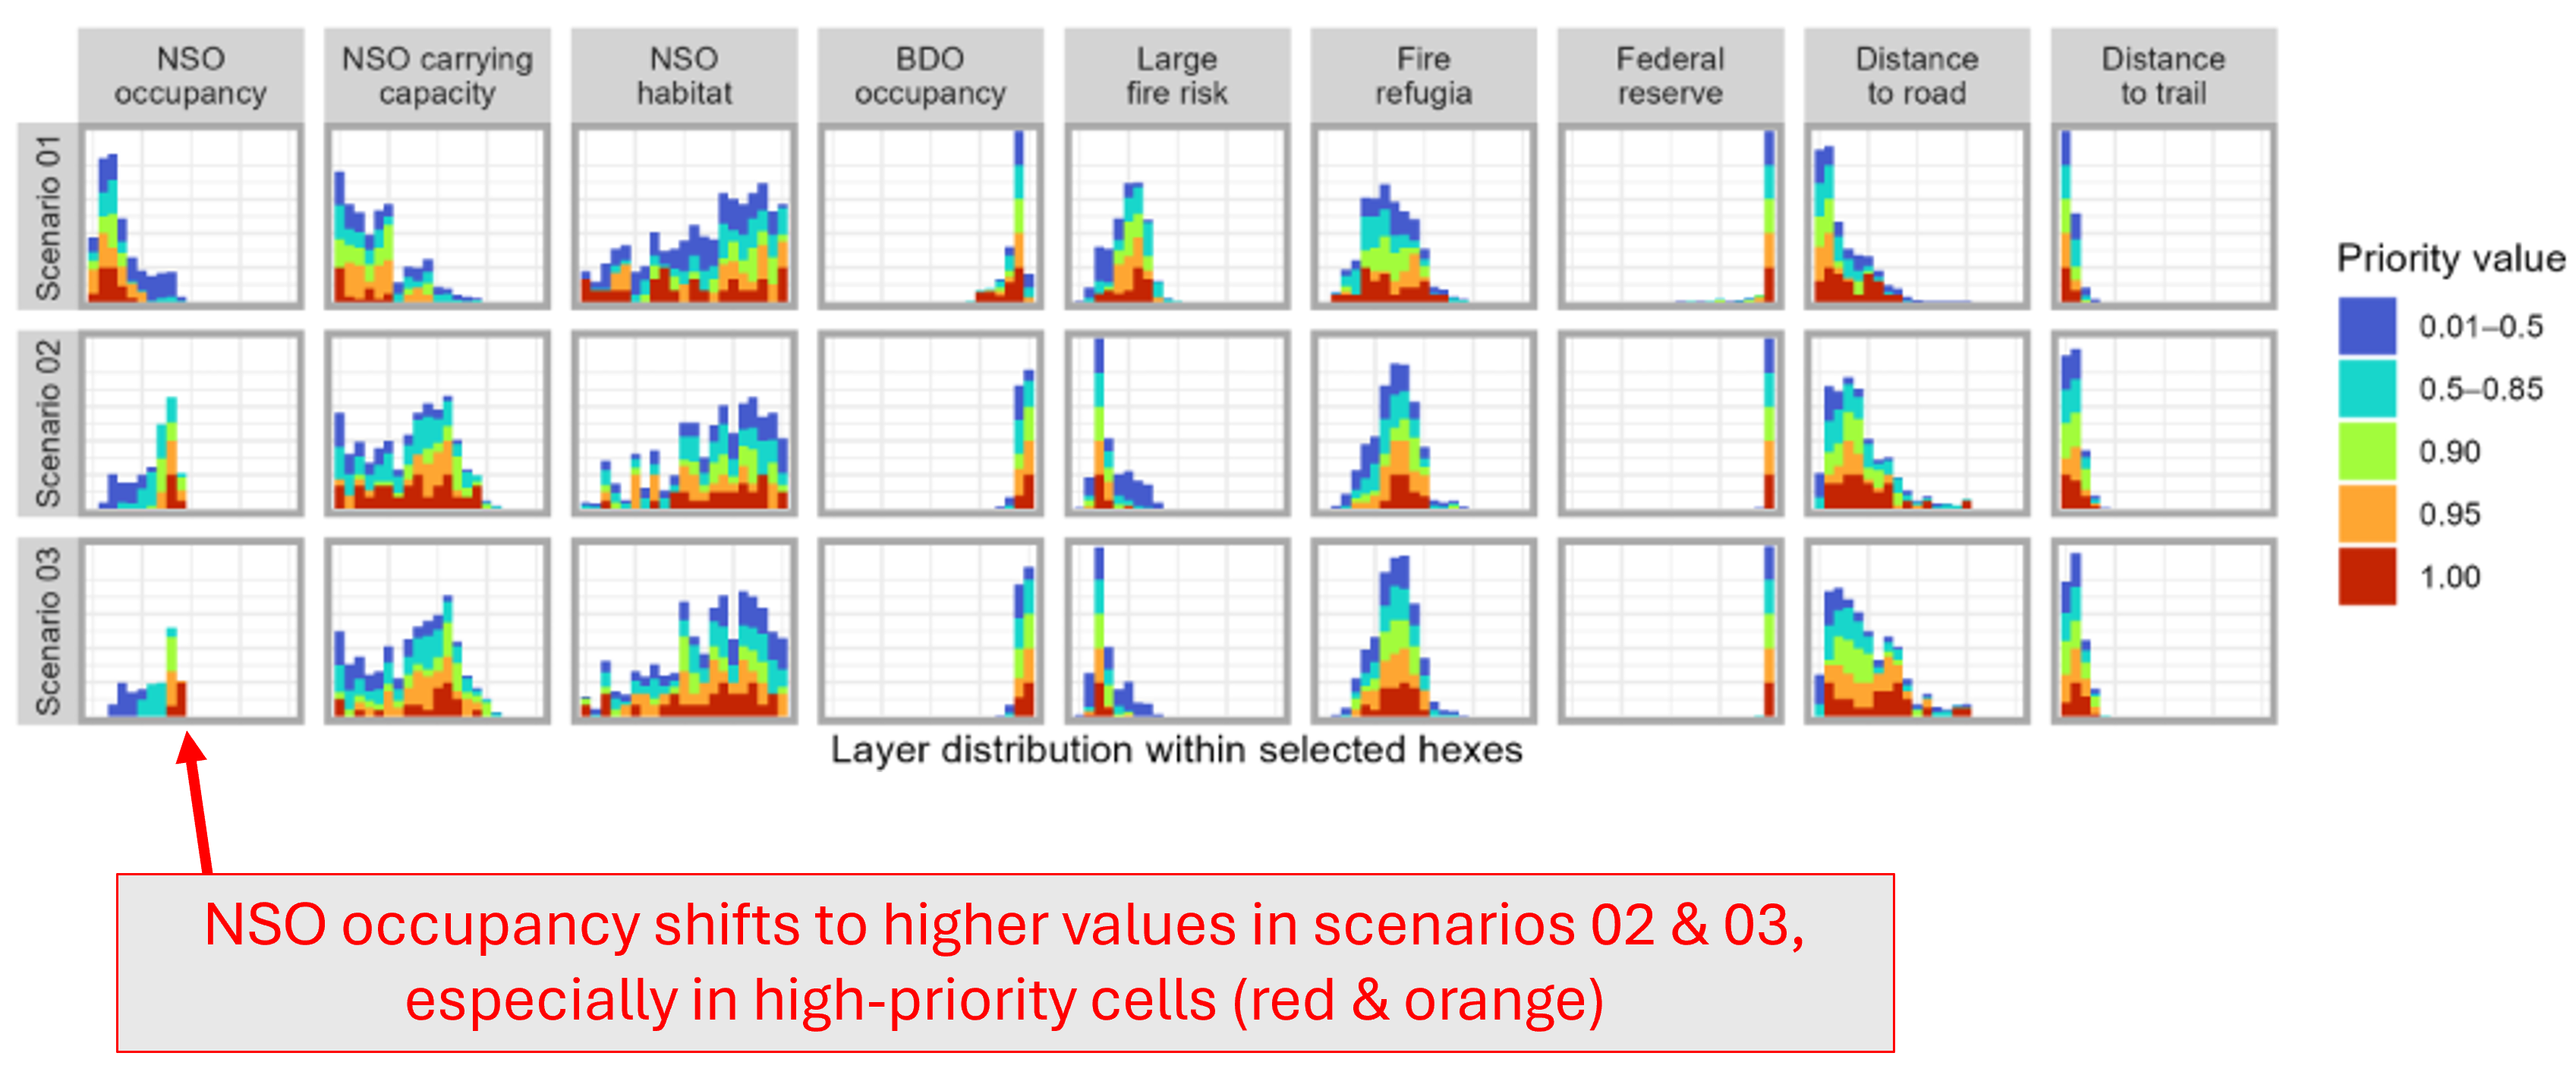
These histograms offer a similar comparison among scenarios as the Summary Table but provide information about hexes with lower and moderate priority values. There is one histogram for each layer (columns) in each of the three scenarios (rows). Like the interactive map, colors correspond to priority scores.
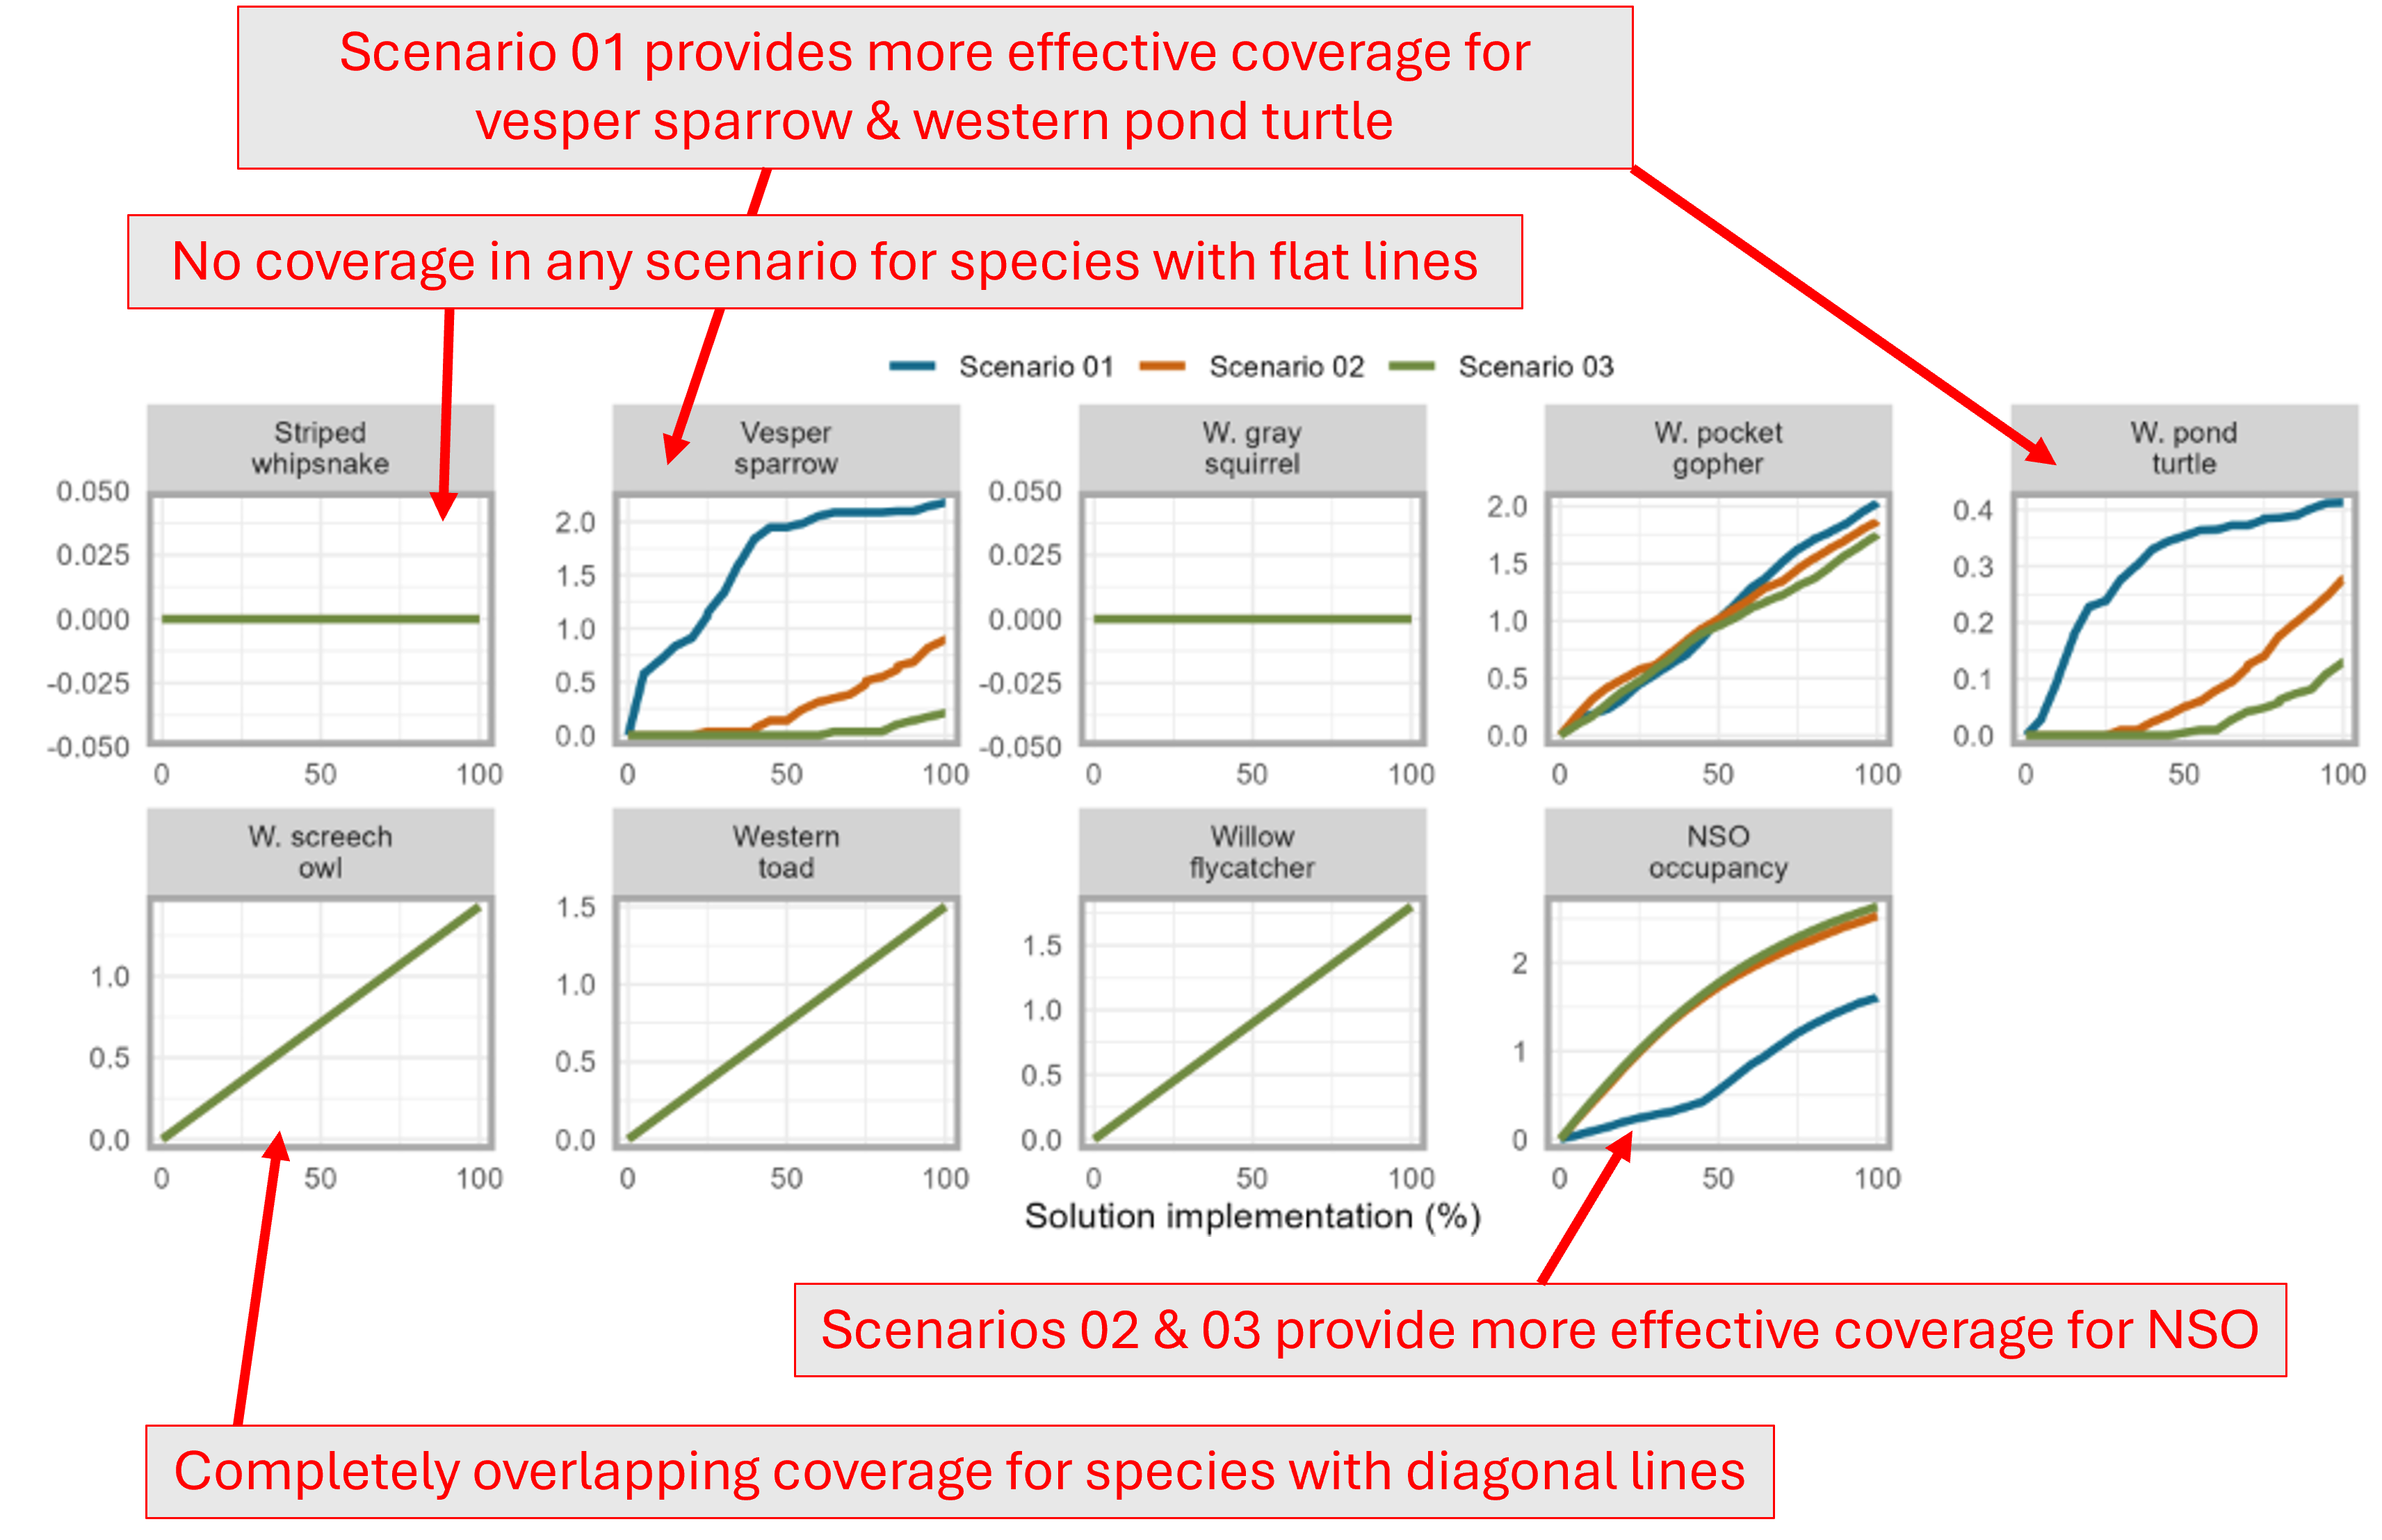
Coverage Plot
These plots depict the degree of overlap between hexes identified as high priority (i.e., any colored hexes in the map) and the geographic range of at-risk species (see Methods for details). Specifically, they depict coverage as a function of implementation. Coverage (the y-axis) is measured as a percent: the percent of a given species' range (within the NWFP region) that overlaps with a given scenario. Solution implementation (x-axis) corresponds to the area under management, where it is assumed that high-priority cells will be selected for management first, followed by moderate- and low-priority cells. Thus, steeper lines represent more effective conservation action: more of a given species' range is covered by management over a smaller area. In this way, the conservation effectiveness of different scenarios can be compared to one another. Each plot corresponds to one species, and the lines within each plot correspond to one of the three scenarios (colored accordingly). If only one line is visible, then the three scenarios have identical coverage for that species. Flat (horizontal) lines occur when a given species' range does not overlap a solution (e.g., all three scenario lines will be flat for a Californian species when viewing results for a GMA in Washington). Conversely, lines following a perfect diagonal occur when a species' range entirely overlaps a given solution (because each % increase in implementation leads to a constant increase in coverage).
Penalties Plot
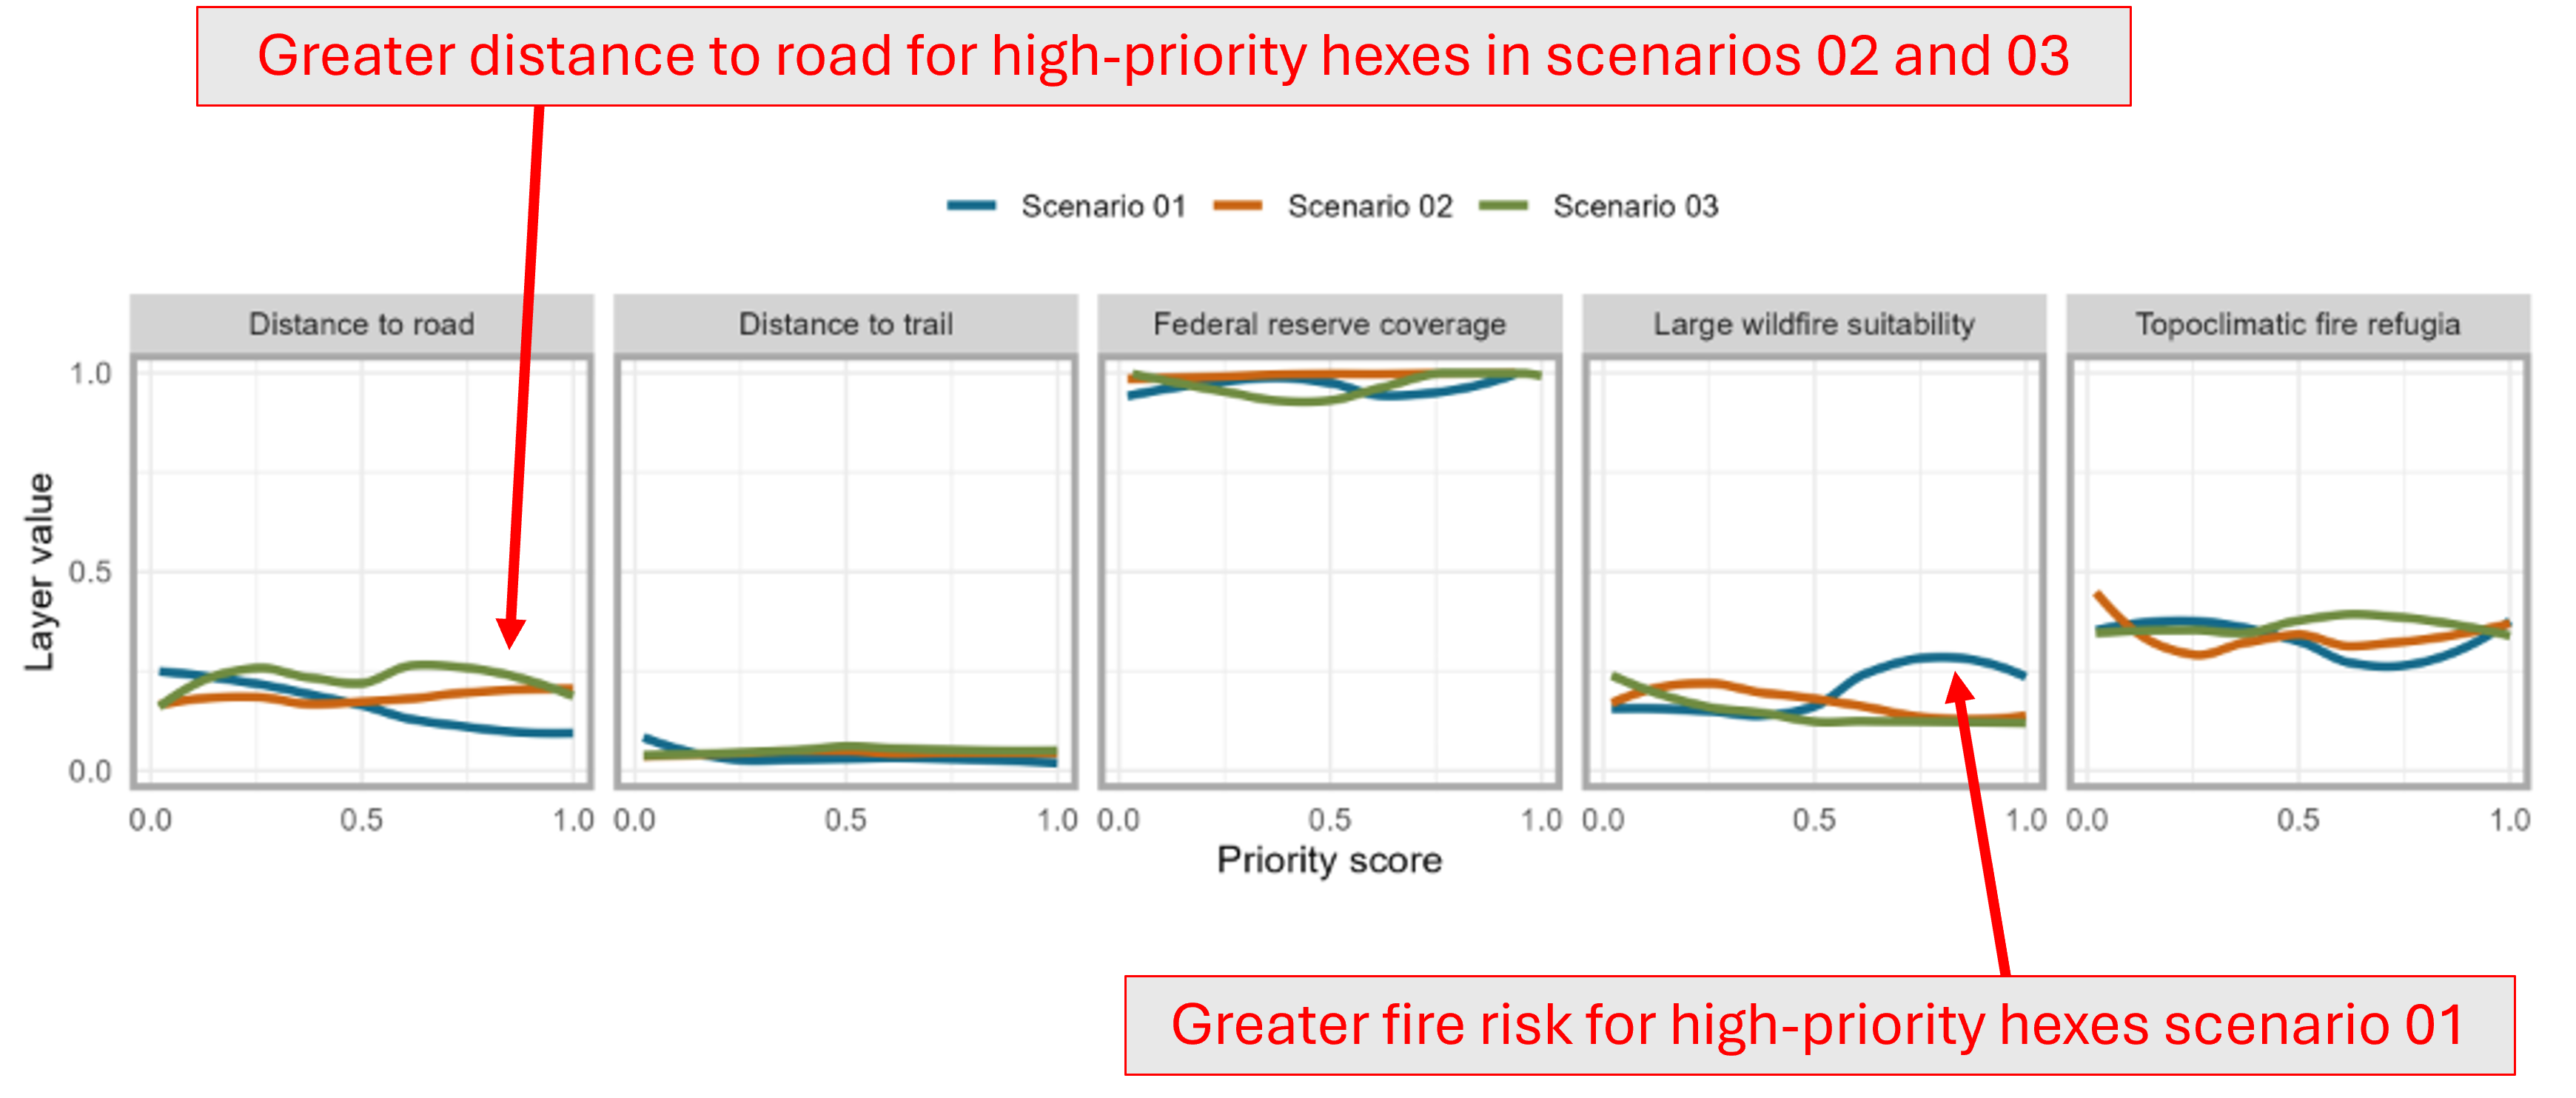
Here users can view the distribution of penalty and incentive layers across priority scores. Note that unlike the coverage plots, the x-axis here is raw priority score and the y-axis is the mean layer value across all hexes with a given score (values for all layers are scaled to have a minimum of 0 and a maximum of 1). These figures can be used to identify tradeoffs among scenarios: perhaps a given scenario is more effective at providing coverage to NSO or some other species but is also relatively fire risky; this will manifest as higher lines on the "Large wildfire suitability" plot, and especially at high priority score values.